Authored by the expert who managed and guided the team behind the South Africa Property Pack

Everything you need to know before buying real estate is included in our South Africa Property Pack
South Africa's property market offers diverse investment opportunities across major cities and provinces, with significant variations in pricing, yields, and growth potential.
As of September 2025, the South African property market has reached record highs with the average residential price surpassing R1.6 million. Cape Town leads the market with exceptional growth, while Johannesburg and Durban offer attractive rental yields for investors seeking steady returns.
If you want to go deeper, you can check our pack of documents related to the real estate market in South Africa, based on reliable facts and data, not opinions or rumors.
Cape Town leads South Africa's property market with 8.5% annual growth and the highest property prices, while Johannesburg offers the best rental yields at 11-16%. Durban presents good value with solid 10-12% rental returns and lower entry costs.
Properties across major metros average 12 weeks on market, with vacancy rates remaining low at around 6-7%. Infrastructure investments of R4.8-6.2 trillion are planned through 2030, particularly benefiting transport and utilities sectors.
| City/Region | Average Property Price | Annual Growth (5-Year) | Rental Yield | Time on Market | Investment Rating |
|---|---|---|---|---|---|
| Cape Town | R3.5 million (luxury areas R20M+) | 141% since 2010, 8.5% (2025) | 9.42% | 10-12 weeks | High Growth |
| Johannesburg | R1.5 million | 71% since 2010, 2.3% (2025) | 11.38% | 11-12 weeks | High Yield |
| Durban | R1.2 million | 98% (national average) | 10.68% | 12-14 weeks | Balanced |
| Pretoria/Tshwane | R1.4 million | 85% since 2010 | 10-12% | 8-10 weeks | Stable |
| Port Elizabeth/Gqeberha | R900,000 | 95% since 2010 | 11-13% | 14-16 weeks | Value Play |

What is the current average property price in each of the main cities or regions?
As of September 2025, South African property prices vary dramatically across major metropolitan areas, reflecting economic opportunities and lifestyle preferences.
Cape Town commands the highest property prices nationally, with luxury areas like Clifton averaging R43 million and Camps Bay exceeding R20 million. Standard residential properties in Cape Town average R3.5 million, driven by semigration trends and international buyer interest.
Johannesburg property prices average R1.5 million across the metro, with premium areas like Sandton reaching R10-15 million for luxury homes. The city's position as South Africa's financial hub supports steady demand despite slower growth compared to Cape Town.
Durban offers more affordable entry points with average residential prices around R1.2 million. Coastal suburbs like Umhlanga command premium prices of R8-12 million, while the broader metro provides excellent value for investors.
It's something we develop in our South Africa property pack.
How much have property prices increased or decreased annually over the past five years in those areas?
South African property markets have shown mixed performance over the past five years, with Cape Town leading growth while other metros experienced more moderate appreciation.
Cape Town has delivered exceptional returns since 2010, with property prices increasing 141% over this period. In 2025 alone, Cape Town recorded 8.5% annual growth, making it the primary driver of national property inflation.
Johannesburg recorded the slowest growth among major metros, with prices rising just 71% since 2010. Recent annual growth has been modest at 2.3% in 2025, reflecting the economic pressures in Gauteng.
The national average shows 98% price growth since 2010, with coastal areas like Scarborough experiencing dramatic 241% increases from R2.3 million in 2016 to R7.85 million in 2025.
Eastern Cape coastal towns emerged as surprise performers with over 8% annual growth, making them the second-highest performing province despite lower absolute prices.
What is the current rental yield percentage in each of these areas?
| City/Region | Average Rental Yield | Yield Range |
|---|---|---|
| Johannesburg | 11.38% | 9.15% - 16.37% |
| Durban | 10.68% | 8% - 13% |
| Centurion | 11.7% | 10.25% - 13.03% |
| Cape Town | 9.42% | 7.19% - 12.15% |
| KZN South Coast | 10.2% | 8.5% - 12% |
| Dolphin Coast | 7.98% | 6.64% - 8.94% |
| National Average | 10.36% | - |
What is the average time a property stays on the market before being sold in those regions?
Property marketing time varies significantly across South African metros, influenced by local demand dynamics and pricing strategies.
The national average time on market reached 12 weeks and one day in Q1 2025, up from 11 weeks in the previous quarter. This represents a return toward the long-term average of approximately 13 weeks.
Johannesburg properties typically sell within 60-90 days (8.5-13 weeks), with well-priced properties in desirable areas moving faster. Premium suburbs like Sandton and Rosebank experience quicker sales due to strong corporate demand.
Cape Town coastal properties, despite higher prices, often sell within 10-12 weeks due to consistent buyer interest from both local and international purchasers. The city's supply constraints keep marketing times relatively short.
Pretoria/Tshwane shows the strongest market dynamics with the lowest average time on market, often selling within 8-10 weeks due to stable government employment and infrastructure development.
Don't lose money on your property in South Africa
100% of people who have lost money there have spent less than 1 hour researching the market. We have reviewed everything there is to know. Grab our guide now.

How does the vacancy rate compare across the main investment areas?
South African rental vacancy rates reached historically low levels in 2025, creating favorable conditions for property investors seeking rental income.
The national residential vacancy rate averaged 6.7% in Q2 2025, down from previous highs. Cape Town boasts the lowest vacancy rate nationally at just 1.07%, reflecting severe undersupply in the rental market.
Johannesburg vacancy rates remain below 7% in most suburbs, with luxury markets showing particularly strong occupancy. High interest rates have pushed more people into rental accommodation, supporting landlord returns.
The first quarter of 2025 recorded the lowest vacancy rates since surveys began in 2016, with rental demand outstripping supply across most major metros. This trend benefits buy-to-let investors with consistent income streams.
TPN data shows the middle-income rental bracket (R4,500-R12,000) demonstrates particularly robust demand, with vacancies well below national averages in this segment.
What are the projected population growth rates for each of these regions over the next decade?
South Africa's population growth projections show regional variations that will impact property demand through 2030 and beyond.
National population growth is projected at 1.34% annually, with South Africa's total population expected to reach approximately 68.8 million by 2030 under moderate migration scenarios.
Cape Town continues experiencing the strongest population growth at 1.72% annually, reaching an estimated 5.06 million residents in 2025. The Western Cape attracts ongoing semigration from other provinces seeking better infrastructure and governance.
Gauteng, including Johannesburg and Pretoria, maintains steady growth driven by employment opportunities, though at more modest rates than coastal areas. The province's share of national economic activity supports continued urbanization.
Urban migration patterns favor major metros over rural areas, with 66.59% of South Africans now living in urban centers. This trend particularly benefits property investors in established metropolitan areas.
How many new housing developments are currently being planned or built in each area?
South Africa's new housing development pipeline reflects both government initiatives and private sector investment, with major projects concentrated in key growth areas.
The Western Cape leads new development activity with the R918 million Leeuloop Precinct in Cape Town creating over 840 housing opportunities, including 350 affordable units. This represents the first major inner-city affordable housing project.
Johannesburg's development pipeline includes the massive Bankenveld District City project, breaking ground in 2025 with over 20,000 housing opportunities and R18 billion in total development value between Sandton and Waterfall.
National residential building approvals dropped 11.7% to 32,674 dwelling units in 2024, reflecting challenging economic conditions. However, completions of 22,764 units still provide ongoing supply to the market.
Major developments like Steyn City in Midrand, Devonbosch in Stellenbosch, and various coastal projects in KwaZulu-Natal continue progressing, though at slower pace than previous years due to construction cost pressures.
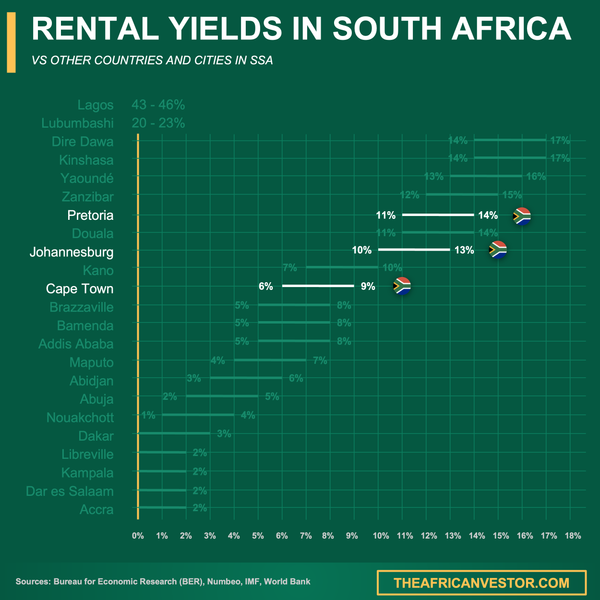
We did some research and made this infographic to help you quickly compare rental yields of the major cities in South Africa versus those in neighboring countries. It provides a clear view of how this country positions itself as a real estate investment destination, which might interest you if you're planning to invest there.
What is the average household income in these regions, and how has it changed over the last five years?
Household income patterns across South African regions directly influence property affordability and investment potential in different metropolitan areas.
Cape Town households report the highest average income at R387,881 annually, with median income of R169,599. This income strength supports the city's premium property prices and continued market growth.
Gauteng, including Johannesburg and Pretoria, shows average household incomes around R25,000 monthly, benefiting from the province's concentration of financial and corporate services.
The Western Cape maintains the highest average household income when compared to other provinces, significantly outpacing areas like North West (R98,147 average expenditure) and Limpopo.
National household income statistics show significant disparities, with households headed by those with tertiary education earning R577,415 annually - almost seven times more than those with no schooling (R84,185).
It's something we develop in our South Africa property pack.
How do employment rates compare across the main areas, and what industries are driving growth?
Employment patterns significantly impact property market dynamics across South African metropolitan areas, with distinct industry concentrations driving regional performance.
South Africa's official unemployment rate stands at 33.2% as of Q2 2025, but regional variations create different investment climates. The Western Cape benefits from lower unemployment and stronger municipal governance.
Gauteng employment centers around financial services, mining headquarters, and manufacturing, with Johannesburg serving as Africa's financial capital. These sectors provide stable rental demand despite broader economic challenges.
Cape Town's economy diversifies across tourism, financial services, technology, and wine production. The city attracts growing numbers of remote workers and digital nomads, supporting rental market demand.
KwaZulu-Natal, including Durban, focuses on port activities, manufacturing, and tourism. Planned infrastructure investments in the R10 billion port expansion should boost employment and property demand.
What are the average property taxes and transaction costs in each region?
| Cost Component | Rate/Amount | Details |
|---|---|---|
| Transfer Duty | 0% - 13% | No duty on properties ≤ R1.21M; 3% on R1.21M-R1.5M; up to 13% on luxury properties |
| Conveyancing Fees | R8,000 - R25,000 | Based on property value; negotiable with attorneys |
| Bond Registration | R5,000 - R15,000 | If financing required; includes legal fees |
| Deeds Office Fees | R1,500 - R3,000 | Administrative registration costs |
| Municipal Rates | 0.5% - 1% annually | Of property's municipal valuation |
| Property Insurance | R3,000 - R6,000 | Annual premiums vary by value and location |
What is the forecasted infrastructure investment in these areas over the next 5 to 10 years?
South Africa has committed to massive infrastructure investments totaling R4.8-6.2 trillion between 2022 and 2030, which will significantly impact property markets across major metropolitan areas.
The national Infrastructure Fund operates with R96 billion in approved projects covering student accommodation, social housing, telecommunications, water, sanitation, and transport. This investment pipeline will boost property values in affected areas.
Gauteng benefits from continued investment in transport links, including Gautrain extensions and highway upgrades. The province's role as an economic hub ensures ongoing infrastructure priority.
Cape Town and the Western Cape receive substantial investment in renewable energy projects, water security initiatives, and transport infrastructure. The province's superior governance attracts both public and private infrastructure investment.
Durban's massive port expansion project worth R5 billion, plus the planned R10 billion international terminal, positions KwaZulu-Natal for significant growth in logistics and manufacturing sectors.
The SA Connect program will roll out broadband to schools, hospitals, and government facilities nationwide, benefiting property values near these upgraded facilities.
How do crime rates and safety indexes compare between the top investment regions?
Safety considerations significantly impact property investment decisions across South African metropolitan areas, with notable variations between regions and suburbs.
South Africa maintains a high crime index of 75.4 in 2024, but regional and local differences create distinct investment climates. The four high-crime provinces - Gauteng, KwaZulu-Natal, Western Cape, and Eastern Cape - contribute most incidents nationally.
Cape Town shows mixed safety outcomes with certain areas like Delft recording 66 murders in recent quarters, while upmarket suburbs like the Atlantic Seaboard maintain relatively better security through private measures.
Johannesburg's northern suburbs including Sandton, Rosebank, and Parktown benefit from extensive private security networks and business district policing, though downtown areas require careful consideration.
Durban coastal areas generally offer better security profiles than inland regions, with beachfront and upmarket suburbs maintaining active security patrols and community initiatives.
Property investors increasingly factor security costs into investment calculations, with sectional title developments and gated communities commanding premiums for enhanced safety features.
Conclusion
This article is for informational purposes only and should not be considered financial advice. Readers are advised to consult with a qualified professional before making any investment decisions. We do not assume any liability for actions taken based on the information provided.
South Africa's property market offers compelling investment opportunities across diverse metropolitan areas, each with distinct advantages for different investor profiles.
Cape Town delivers exceptional capital growth potential but requires higher entry costs, while Johannesburg provides superior rental yields for income-focused investors. Durban offers balanced opportunities with moderate pricing and solid returns, making it attractive for first-time property investors in South Africa.
Sources
- Global Property Guide - South Africa Property Price History
- Global Property Guide - South Africa Rental Yields
- The Africanvestor - Average House Price South Africa
- Statistics South Africa - Income & Expenditure Survey
- World Bank - South Africa Infrastructure Investment Needs
- South African Government - Labour Force Survey Q1 2025
- South African Revenue Service - Transfer Duty Rates
- BusinessTech - South Africa Rental Market Analysis