Authored by the expert who managed and guided the team behind the South Africa Property Pack
Yes, the analysis of Cape Town's property market is included in our pack
Cape Town's property market continues to outperform the rest of South Africa with average annual price growth of 8.5% in 2025.
The Mother City's residential market shows exceptional strength across all key metrics, driven by semigration from Gauteng, record foreign investment, and supply constraints that keep vacancy rates below 2%.
If you want to go deeper, you can check our pack of documents related to the real estate market in South Africa, based on reliable facts and data, not opinions or rumors.
Cape Town's property market leads South Africa with 8.5% annual growth in 2025, supported by strong foreign investment and semigration.
Prime suburbs deliver rental yields of 6-8%, while low vacancy rates below 2% indicate exceptional demand outpacing supply.
| Metric | Cape Town | National Average |
|---|---|---|
| Annual Price Growth (2025) | 8.5% | 5.2% |
| Average Price per sqm | R31,000 | R9,600-16,700 |
| Rental Yields (Prime Areas) | 6-8% | 6-7% |
| Vacancy Rate | 1-2% | 6%+ (Gauteng) |
| Time on Market | 60-90 days | 6+ months |
| Foreign Investment Share | 65% (luxury) | Low |
| Price Forecast 2026-2027 | 3-7% annually | Lower |

What has been the average year-on-year property price growth in Cape Town over the past five years, and is it expected to accelerate or slow down in the next two years?
Cape Town property prices have grown at an average of 4-5% annually over the past five years, with a significant acceleration to 8.5% year-on-year growth in 2025.
This 8.5% growth rate positions Cape Town as one of South Africa's strongest performing property markets, outpacing cities like Johannesburg which recorded only 2.3% annual growth in 2025. The acceleration from the historical 4-5% range reflects increased demand from both domestic semigration and foreign investment.
Property price forecasts for Cape Town suggest annual growth will moderate to 3-7% through 2026 and 2027. This expected slowdown from the current 8.5% rate is attributed to affordability constraints and supply limitations that make sustained double-digit growth unsustainable.
The moderation doesn't signal weakness but rather a normalization after exceptional recent performance. Cape Town's fundamentals remain strong with continued semigration from Gauteng, record foreign investment levels, and supply shortages supporting price stability.
As of September 2025, the market shows no signs of sharp correction, with forecasters expecting Cape Town to maintain its position as South Africa's best-performing major property market.
How do current property prices in Cape Town compare to the national average, both in rand per square meter and in annual growth rates?
Cape Town's current average property price stands at R3.5 million, with prime suburbs commanding R31,000 per square meter as of 2025.
This represents a significant premium over national averages, where properties typically range from R9,600 to R16,700 per square meter. Even within the Western Cape province, the overall average remains lower at R14,800 per square meter, highlighting Cape Town's premium positioning.
The price gap extends to annual growth rates, where Cape Town's 8.5% growth in 2025 substantially exceeds the national average of 5.2%. Compared to other major cities, Cape Town's performance is exceptional - Johannesburg managed only 2.3% growth, while the Western Cape province overall achieved approximately 4.8%.
These price premiums reflect Cape Town's unique combination of lifestyle appeal, economic opportunities, and international investment interest. The city's property market operates at a different level from most South African locations, with pricing that reflects global rather than purely domestic demand patterns.
It's something we develop in our South Africa property pack.
What are the latest rental yields in key suburbs such as City Bowl, Sea Point, and Claremont, and how do they compare to the national average yield of around 6–7%?
Cape Town's key suburbs deliver rental yields that meet or exceed the national average of 6-7%, with some areas significantly outperforming this benchmark.
| Suburb | Rental Yield Range | Key Drivers |
|---|---|---|
| City Bowl | 5.5-7.5% | Professional and student demand |
| Sea Point | 6-7% | Tourism and prime location |
| Claremont | 5-6% | Schools and universities proximity |
| Woodstock | 8%+ | Emerging area with high demand |
| Observatory | 8%+ | Student rental market |
| Bellville | 8%+ | Affordable housing high demand |
| Salt River | 8%+ | Urban regeneration area |
What is the current vacancy rate in residential properties across Cape Town, and how has it changed over the past 12 months?
Cape Town's residential vacancy rate sits at record lows of 1-2% as of Q3 2024, extending into 2025 with rates remaining below 3%.
This represents a dramatic improvement from pandemic-era highs experienced in 2020-2021, when vacancy rates were significantly elevated due to economic uncertainty and reduced migration. The current low vacancy rates indicate exceptional demand relative to available rental stock.
The Western Cape maintains the lowest vacancy rate in South Africa, creating a stark contrast with Gauteng province where vacancy rates exceed 6%. This disparity reflects the sustained appeal of Cape Town as both a lifestyle destination and economic hub.
Over the past 12 months, vacancy rates have continued to decline due to ongoing semigration from other provinces and increased tenant demand across all segments. The trend shows no signs of reversing, with supply constraints limiting new rental stock additions.
These historically low vacancy rates provide landlords with exceptional pricing power and indicate a structurally undersupplied rental market that supports continued rental growth.
How many new housing units are being built annually in Cape Town, and how does this pipeline compare to estimated demand?
Cape Town faces a severe housing shortage with over 400,000 people on the city's waiting list while annual completions remain under 5,000 units.
The city has a pipeline of 12,000 affordable homes planned, but new builds consistently fail to keep pace with demand due to regulatory constraints, rising construction costs, and limited available land. This supply-demand imbalance is a fundamental driver of Cape Town's strong property price performance.
Annual housing demand far exceeds the modest supply additions, creating structural upward pressure on both purchase prices and rental rates. The gap between supply and demand has widened rather than narrowed in recent years.
Regulatory bottlenecks, lengthy approval processes, and infrastructure constraints limit developers' ability to scale construction to meet demand. These supply constraints are particularly acute in well-located areas where demand is highest.
The chronic undersupply situation supports long-term property price appreciation and rental growth, as demand continues to outstrip new housing additions across all market segments.
What has been the average time a property spends on the market before being sold in 2023 and 2024, compared to 2020 or 2021?
Properties in Cape Town's high-demand areas now sell within 60-90 days during 2023-2025, representing a significant acceleration from the six months or longer typical during the 2020-2021 pandemic period.
The faster selling times reflect the market's return to strength after pandemic-related disruptions, supported by increased buyer activity from both domestic semigration and international investment. Well-priced properties in desirable locations often receive multiple offers within weeks of listing.
Less serviced locations or properties outside prime areas may still require longer marketing periods, but even these have improved from pandemic lows when uncertainty kept buyers on the sidelines for extended periods.
The acceleration in selling times indicates a seller's market in most Cape Town suburbs, where quality properties attract buyer interest quickly. This contrasts sharply with the buyer's market conditions experienced during peak pandemic uncertainty.
Faster transaction times also reflect improved buyer confidence, better financing availability, and the return of international buyers who were largely absent during travel restrictions in 2020-2021.
Don't lose money on your property in Cape Town
100% of people who have lost money there have spent less than 1 hour researching the market. We have reviewed everything there is to know. Grab our guide now.

How have interest rates and lending conditions from major South African banks affected property affordability in Cape Town over the last year?
Interest rates have decreased over the past year, with the prime rate falling from 11.75% in late 2024 to 10.75% by mid-2025, improving property affordability and boosting home loan applications in Cape Town.
This 100 basis point reduction has made property financing more accessible, enabling more buyers to qualify for mortgages and reducing monthly repayment burdens. The improved lending environment has contributed to increased transaction activity across Cape Town's property market.
However, affordability remains challenging for average-priced Cape Town properties, with monthly repayments for the average R3.5 million property exceeding R35,000 per month even at current lower rates. This payment level limits market participation to higher-income households.
Major South African banks have maintained relatively stable lending criteria while benefiting from lower rates, though deposit requirements and income verification remain stringent. The combination of lower rates and stable lending standards has supported market activity.
The rate reduction timeline coincides with Cape Town's accelerated price growth, suggesting that improved financing costs have enabled more buyers to participate in the market despite rising property values.
What percentage of property sales in Cape Town are cash purchases versus financed purchases, and how has this ratio evolved since 2019?
Cash purchases have increased significantly in Cape Town's luxury segments, reaching up to 65% of international sales in areas like the Atlantic Seaboard and CBD.
This represents a substantial shift from pre-2019 levels when cash purchases were much lower, reflecting the surge in foreign investment and high-net-worth buyer activity post-pandemic. International and affluent domestic buyers increasingly prefer cash transactions for speed and negotiating advantage.
Financed purchases remain dominant in Cape Town's middle-market segments, but the overall ratio has shifted toward more cash transactions due to both lower interest rates enabling cash deployment and increased foreign capital inflows since 2019.
The luxury property segment particularly shows this trend, where international buyers often purchase with cash to avoid financing complexities and currency risks. This has created a two-tier market with different purchasing patterns by price segment.
The evolution toward more cash purchases has supported market liquidity and faster transaction times, as cash offers typically close more quickly than financed purchases requiring bank approvals and valuations.
Which Cape Town suburbs have recorded the highest capital appreciation in the last three years, and by how much in percentage terms?
The Atlantic Seaboard leads Cape Town's capital appreciation with exceptional growth across multiple suburbs over the past three years.
1. **Llandudno**: 135% growth since 2019, making it the standout performer2. **Hout Bay**: 49% appreciation, benefiting from its scenic location and lifestyle appeal3. **Sea Point, Clifton, Camps Bay, Bantry Bay**: Double-digit capital appreciation across the Atlantic Seaboard4. **City Bowl**: Robust gains driven by urban living demand and proximity to business districts5. **Woodstock and Observatory**: Strong growth as emerging areas attracting young professionals6. **Green Point**: Significant appreciation supported by stadium precinct development and waterfront proximityThese appreciation rates far exceed most other South African property markets and reflect Cape Town's unique combination of lifestyle appeal, supply constraints, and investment demand. The Atlantic Seaboard's performance particularly stands out due to its coastal location and luxury market dynamics.
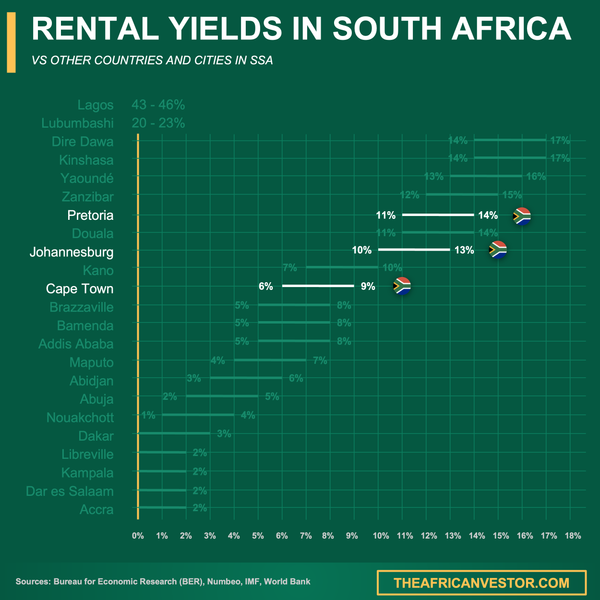
We did some research and made this infographic to help you quickly compare rental yields of the major cities in South Africa versus those in neighboring countries. It provides a clear view of how this country positions itself as a real estate investment destination, which might interest you if you're planning to invest there.
How has the influx of semigration from Gauteng and other provinces influenced Cape Town property demand, both in volume of transactions and price increases?
Semigration from Gauteng and other provinces serves as a key driver of Cape Town's exceptional property demand and price appreciation, with the city absorbing significant volumes of new buyers and tenants at premium prices.
This internal migration has led to higher transaction volumes across Cape Town's property market, as relocating households typically purchase rather than rent long-term. The sustained flow of semigration buyers provides consistent demand that supports price growth well above national averages.
Semigration buyers often arrive with substantial equity from selling properties in their previous locations, enabling them to purchase in Cape Town's higher-priced market. This capital transfer from other provinces directly supports Cape Town's price premium over national levels.
The trend has accelerated post-pandemic as remote work enables location flexibility, with many professionals choosing Cape Town for lifestyle reasons while maintaining income levels from other provinces. This demographic shift supports sustained demand growth.
It's something we develop in our South Africa property pack.
What role is foreign investment playing in Cape Town's property market, and what share of sales is attributed to international buyers compared to pre-pandemic levels?
Foreign investment in Cape Town reached record levels in 2025, with international buyers spending over R1 billion in just five months, representing a dramatic increase from much lower pre-pandemic levels.
International buyers now account for over 65% of sales in luxury areas including the Atlantic Seaboard, City Bowl, and top southern suburbs. This represents a significant surge from pre-2020 levels when foreign investment was substantially lower and less concentrated.
The post-pandemic surge reflects multiple factors including the rand's weakness making Cape Town property attractive to foreign currency holders, lifestyle appeal for international buyers, and South Africa's relatively straightforward property purchase process for foreigners.
Foreign investment particularly concentrates in prime coastal and city center locations, with international buyers willing to pay premium prices for quality properties in desirable areas. This has created upward pressure on luxury property prices.
The sustained high level of foreign investment provides Cape Town's property market with a buffer against domestic economic challenges and adds international demand dynamics that support price resilience.
How is Cape Town's property market expected to perform relative to Johannesburg, Durban, and smaller coastal towns in the next three to five years, in terms of both price growth and rental demand?
Cape Town is expected to significantly outperform Johannesburg, Durban, and smaller coastal towns in both price growth and rental demand over the next three to five years.
Projected annual price growth of 3-7% for Cape Town compares favorably to Johannesburg's weaker 2.3% annual growth in 2025, with this performance gap likely to persist. Cape Town's superior economic fundamentals, lifestyle appeal, and international investment interest provide sustainable competitive advantages.
Rental demand in Cape Town benefits from the city's central and tourist-heavy neighborhoods delivering higher yields than national averages, while low vacancy rates below 2% indicate structural undersupply that supports continued rental growth.
The combination of high demand, low vacancy rates, strong foreign investment, and consistent semigration will keep Cape Town's market resilient relative to other South African cities. Durban and smaller coastal towns lack Cape Town's scale of international appeal and economic diversity.
Cape Town's market operates with different fundamentals than other South African cities, benefiting from global rather than purely domestic demand patterns that provide insulation from purely local economic cycles.
Conclusion
This article is for informational purposes only and should not be considered financial advice. Readers are advised to consult with a qualified professional before making any investment decisions. We do not assume any liability for actions taken based on the information provided.
Cape Town's property market demonstrates exceptional strength across all key metrics, positioning it as South Africa's premier real estate investment destination.
The combination of record foreign investment, sustained semigration, supply constraints, and lifestyle appeal creates a robust foundation for continued outperformance relative to other South African markets.
It's something we develop in our South Africa property pack.
Sources
- Cape Town Real Estate Trends
- RP Realty Plus - Cape Town House Price Growth
- Cape Town Price Forecasts
- Ooba - Cost to Build a House
- Statistics South Africa
- Cape Town Property Insights
- Cape Town Property Investment Guide
- Investing Property South Africa Worth It
- Property Wheel - State of SA Property Market
- Known Magazine - Cape Town Rentals