Authored by the expert who managed and guided the team behind the South Africa Property Pack
Yes, the analysis of Cape Town's property market is included in our pack
Cape Town's residential property market has outperformed South Africa's national averages by substantial margins over the past five years.
With strong international buyer activity, constrained supply in prime areas, and attractive rental yields, Cape Town presents both opportunities and challenges for property investors and residents considering whether to buy now.
If you want to go deeper, you can check our pack of documents related to the real estate market in South Africa, based on reliable facts and data, not opinions or rumors.
Cape Town property prices have increased 30-35% over five years versus 24% nationally, making affordability challenging with price-to-income ratios of 10-14x.
Despite high prices, rental yields remain competitive at 7-8% citywide, and foreign buyers continue driving demand in premium areas like Sea Point and the Atlantic Seaboard.
| Key Metric | Cape Town Current Status | Comparison/Context |
|---|---|---|
| 5-Year Price Growth | 30-35% increase | National average: 24% |
| Annual Price Growth (2025) | 8.5% | National: 5.2%, Johannesburg: 2.3% |
| Price per sqm - Sea Point | R33,000-R65,000 | Premium Atlantic Seaboard location |
| Price per sqm - Durbanville | R18,000-R25,000 | Northern suburbs, more affordable |
| Average Rental Yield | 7-8% | Emerging areas: 8-12% |
| Price-to-Income Ratio | 10-14x | Above global affordability thresholds |
| Foreign Buyer Activity | R1+ billion in 5 months | 40-50% of premium sales |
| 2025-2027 Forecast | 3-7% annual growth | Prime areas to outperform |

How much have average house prices in Cape Town changed over the past five years compared to national averages?
Cape Town's residential property market has significantly outperformed the national average over the past five years.
Average house prices in Cape Town have increased by 30-35% from 2020 to 2025, compared to a national average increase of just 24% during the same period. As of September 2025, Cape Town recorded an annual price growth rate of 8.5%, while the national average sits at 5.2% and Johannesburg trails at only 2.3%.
The Western Cape province, led by Cape Town, has consistently shown the highest provincial growth rates in South Africa. This divergence is most pronounced in prime coastal neighborhoods and high-demand central areas, where international buyer activity and limited supply continue to drive prices upward.
The strong performance reflects Cape Town's appeal as both a lifestyle destination and investment hub, attracting both domestic and foreign buyers willing to pay premium prices for quality properties in desirable locations.
What is the current price per square meter in central Cape Town versus suburbs like Claremont, Sea Point, and Durbanville?
Property prices per square meter vary significantly across Cape Town's different neighborhoods, reflecting location desirability and amenities.
| Area | Price per Square Meter | Characteristics |
|---|---|---|
| Central Cape Town (CBD) | R30,000 | Business district, some premium buildings higher |
| Sea Point (Atlantic Seaboard) | R33,000-R65,000 | Ocean views, premium developments |
| Claremont (Southern Suburbs) | R20,000-R28,000 | Family-friendly, good schools |
| Durbanville (Northern Suburbs) | R18,000-R25,000 | More affordable, wine country proximity |
| Woodstock/Observatory | R15,000-R22,000 | Emerging areas, artistic communities |
Sea Point commands the highest prices due to its Atlantic Seaboard location, ocean views, and proximity to beaches and the CBD. Central Cape Town offers urban convenience but prices vary significantly based on building quality and specific location within the CBD.
How do local incomes and median household earnings in Cape Town compare to current property prices?
Cape Town faces a significant affordability challenge with property prices far exceeding local income levels.
The median household income in Cape Town as of September 2025 is approximately R387,000 per year (R32,250 per month), with average after-tax household incomes ranging between R26,800-R30,000 monthly. Meanwhile, the average house price in Cape Town has reached R3-3.5 million.
This creates a price-to-income ratio of approximately 10-14 times annual household income, significantly above the 3-5 times ratio typically considered affordable in global markets. For context, a household earning the median income would need to save their entire gross income for 10-14 years to afford an average Cape Town property, assuming no other expenses.
This affordability gap explains why many local buyers are priced out of certain neighborhoods, particularly in the Atlantic Seaboard and central areas, where international buyers with stronger currencies can compete more effectively.
It's something we develop in our South Africa property pack.
What is the current rental yield across popular Cape Town neighborhoods, and does it justify buying over renting?
Cape Town offers competitive rental yields compared to other major South African cities, making property investment attractive despite high purchase prices.
Gross rental yields average around 7% across mainstream Cape Town areas, with variation by neighborhood. Cape Town City Centre and emerging suburbs like Woodstock, Observatory, and Salt River frequently achieve 8% gross yields. Luxury areas typically deliver lower returns of 4-6%, while emerging neighborhoods can reach 8-12%.
These yields remain relatively competitive versus other major South African metros, supported by consistently low vacancy rates and strong rental demand from students, young professionals, and international residents. The rental market benefits from Cape Town's status as a university city and business hub.
For investors, buying can be justified in areas achieving 7%+ yields, especially when factoring in potential capital appreciation. However, renters benefit from flexibility and avoiding large upfront costs, particularly in expensive areas like Sea Point where purchase prices may not justify rental income for several years.
The decision depends on individual circumstances, investment timeline, and risk tolerance regarding future price movements.
How do Cape Town mortgage interest rates and required deposits compare with those in Johannesburg and Durban right now?
Mortgage rates and deposit requirements are standardized across South African cities, with no significant differences between Cape Town, Johannesburg, and Durban.
As of September 2025, the prime lending rate stands at 10.50% nationwide, applied consistently across all major South African cities. This rate is set by the South African Reserve Bank's monetary policy and affects all domestic mortgage lending equally.
Required deposits typically range from 10-20% for local buyers seeking optimal interest rates, though some banks may finance up to 100% for qualified applicants with excellent credit. Foreign buyers face stricter requirements, usually needing to finance at least 50% of the purchase price from abroad due to exchange control regulations.
The uniform nature of South African banking regulations means that geographic location doesn't affect mortgage terms. However, property values differ significantly between cities, so the same deposit percentage translates to much higher absolute amounts in Cape Town's more expensive market compared to Durban or certain Johannesburg areas.
Don't lose money on your property in Cape Town
100% of people who have lost money there have spent less than 1 hour researching the market. We have reviewed everything there is to know. Grab our guide now.

What proportion of recent property sales in Cape Town are to foreign buyers, and how does this affect prices?
Foreign buyers represent a substantial portion of Cape Town's property market, particularly in premium areas, significantly influencing price dynamics.
Foreign buyers purchased nearly R1 billion worth of Cape Town property in just the first five months of 2025, representing approximately 40-50% of high-end and premium area sales. This activity is heavily concentrated in the Atlantic Seaboard, City Bowl, and areas with ocean views or strong international appeal.
The impact on prices is substantial and multifaceted. Foreign buyers typically purchase with stronger currencies (USD, EUR, GBP), making them less sensitive to rand-denominated prices. This creates upward pressure on prices, especially in luxury markets where international buyers compete against each other and affluent local buyers.
The concentration of foreign buying in specific areas creates price bubbles in popular neighborhoods while having minimal impact on more affordable suburbs. Properties with international appeal (security, views, proximity to amenities) see the strongest price appreciation due to this foreign demand.
This trend has priced many local buyers out of traditional high-end areas, forcing them to consider alternative neighborhoods or delaying purchases entirely.
How many months of inventory are currently available on the Cape Town property market, and is this trending up or down?
Cape Town's property market shows clear signs of constrained inventory, indicating a tight supply-demand balance favoring sellers.
As of mid-2025, data indicates a tight market with low months of supply, particularly in popular suburbs and premium areas. Sales volumes have reached record levels in early 2025, reflecting strong demand that is outpacing available inventory.
The trend is toward decreasing inventory in desirable areas, though some price stabilization is emerging in entry-level and peripheral markets. This imbalance is most pronounced in the Atlantic Seaboard, City Bowl, and established Southern Suburbs where demand from both local upgraders and international buyers exceeds the rate of new listings.
Limited inventory supports continued price appreciation and gives sellers negotiating power. Buyers often face multiple offer situations in popular areas, sometimes paying above asking prices to secure properties.
New construction is helping to address supply constraints, but planning delays, skills shortages, and zoning restrictions limit the pace of new supply additions relative to demand growth.
What are the latest Cape Town municipal rates, taxes, and levies, and how much do they add to the cost of owning property?
Municipal costs in Cape Town have increased significantly, adding substantial ongoing expenses to property ownership beyond mortgage payments.
The base property rate for residential properties stands at 0.007159 per rand of municipal value for 2025/26, representing a 7.96% increase for the year—well above general inflation rates. Properties valued below R435,000 receive exemptions, while pensioners may qualify for rebates.
Additional costs include special area levies in jurisdictional improvement districts such as the City Bowl and Camps Bay, plus monthly charges for water, sanitation, refuse collection, and electricity. These fixed tariffs and levies are increasingly linked to property value and can add several thousand rand monthly to ownership costs.
For a property valued at R3 million, annual municipal rates alone would amount to approximately R21,477, or about R1,790 monthly. Combined with other municipal services, total monthly municipal costs can easily reach R3,000-R5,000 depending on usage and property location.
These escalating municipal costs represent a significant factor in total cost of ownership, particularly affecting investors calculating rental yields and homeowners managing monthly budgets.
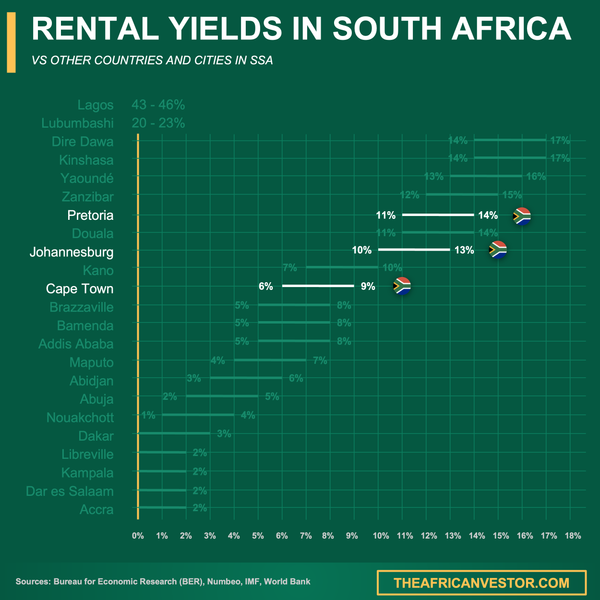
We did some research and made this infographic to help you quickly compare rental yields of the major cities in South Africa versus those in neighboring countries. It provides a clear view of how this country positions itself as a real estate investment destination, which might interest you if you're planning to invest there.
How does the current demand for Cape Town property compare to supply, based on recent transaction volumes?
Cape Town's property market demonstrates a clear demand-supply imbalance, with transaction volumes reaching record levels despite limited inventory.
Transaction volumes in Cape Town have hit record levels in early 2025, especially in premium markets, reinforcing strong buyer demand that exceeds available supply. This activity spans both the luxury market driven by international buyers and the mid-market segment where local upgraders and first-time buyers compete for limited stock.
The strongest demand exists for well-located, high-specification, and secure properties in established neighborhoods. Areas offering lifestyle amenities, good schools, and security appeal see multiple offers and quick sales, often above asking prices.
Outer or less preferred areas experience more balanced supply-demand conditions, though even these markets show increased activity compared to previous years. The demand concentration in prime locations creates a two-tier market where desirable properties sell quickly while others may linger.
This imbalance supports seller confidence and continued price appreciation, particularly in neighborhoods where supply additions face planning and zoning constraints.
What are the current construction and development trends in Cape Town, and are they likely to ease or push prices higher?
Construction activity in Cape Town is increasing but remains insufficient to meet demand in prime areas, likely supporting continued price growth.
Significant private and public infrastructure investment and new developments are visible across the CBD, Century City, and upmarket suburbs. Sustainability and mixed-use projects are becoming increasingly common, reflecting changing buyer preferences and regulatory requirements.
Despite large-scale construction activity, overall supply growth remains below demand in prime and central locations, implying continued price support. New developments often target the luxury segment, adding supply at higher price points rather than addressing affordability challenges.
However, construction faces several constraints that limit supply expansion rates. Zoning restrictions, planning delays, skills shortages, and rising input costs cap the pace at which new supply can enter the market. These factors mean construction costs are increasing, feeding through to higher prices for new developments.
The net effect suggests that while construction activity will help moderate price growth compared to a scenario with no new supply, it's unlikely to create enough inventory to substantially reduce prices in desirable areas over the next 2-3 years.
It's something we develop in our South Africa property pack.
How have inflation and the rand's exchange rate over the past year influenced Cape Town property prices?
Inflation moderation and rand volatility have created favorable conditions for property price growth, particularly benefiting international buyers.
Inflation has remained between 2.8-4.5% in 2025, below the South African Reserve Bank's target midpoint, enabling interest rate cuts for much of the year. This has reduced borrowing costs and improved affordability for domestic buyers, supporting demand and price growth.
Ongoing rand volatility has made Cape Town property relatively cheaper for foreign currency buyers, supporting strong international demand and upward pressure on upper-end prices. When the rand weakens, foreign buyers can acquire more property for the same foreign currency amount, intensifying competition in premium markets.
Construction input costs have risen due to both global commodity price increases and rand weakness affecting imported materials. These higher costs feed through to new development prices, creating a floor effect on pricing for new construction projects.
The combination of lower domestic interest rates and favorable exchange rates for foreign buyers has created a supportive environment for price appreciation, particularly in areas with international appeal.
What forecasts are major South African banks and property analysts making for Cape Town prices over the next 12 to 24 months?
Major financial institutions and property analysts expect Cape Town to continue outperforming the national market, with moderate but sustained price growth over the next two years.
For 2025-2027, major banks and analysts forecast 3-7% annual Cape Town price growth, with citywide prices expected to stabilize but prime areas and new developments likely to outperform these averages. This contrasts with more modest national price growth expectations of 1.8-3.5% annually.
The forecasts reflect several supporting factors: continued international buyer interest, constrained supply in popular areas, ongoing infrastructure investment, and Cape Town's enduring appeal as a lifestyle destination. However, analysts also note potential headwinds including affordability constraints for local buyers and possible policy changes affecting foreign ownership.
Prime areas including the Atlantic Seaboard, City Bowl, and select Southern Suburbs are expected to see the strongest performance, driven by limited supply and sustained international demand. More affordable areas may see steadier, moderate growth as local buyers seek value in alternative neighborhoods.
Major urban nodes like Cape Town are expected to continue attracting the bulk of domestic and international investor interest, supporting their outperformance relative to national averages.
It's something we develop in our South Africa property pack.
Conclusion
This article is for informational purposes only and should not be considered financial advice. Readers are advised to consult with a qualified professional before making any investment decisions. We do not assume any liability for actions taken based on the information provided.
Cape Town's robust price growth—powered by scarce supply, lifestyle appeal, and active international buyer participation—surpasses national trends, especially in sought-after districts.
Rental yields remain attractive by local standards, and current mortgage rates plus eased inflation bolster short- and medium-term investor confidence, though high price-to-income ratios and rising municipal costs present affordability challenges.
Sources
- Statistics South Africa - House Price Data
- RP Realty Plus - Cape Town Price Growth
- The AfricanVestor - Average House Prices South Africa
- The AfricanVestor - Cape Town Price Forecasts
- The AfricanVestor - Cape Town Real Estate Market
- LinkedIn - Cape Town Real Estate Statistics 2025
- Ooba - Home Loan Interest Rates
- City of Cape Town - Rates and Tariffs Calculator
- Property24 - Investment Markets 2025
- The AfricanVestor - South Africa Property Forecast