Authored by the expert who managed and guided the team behind the Cape Town Property Pack
Yes, the analysis of Cape Town's property market is included in our pack
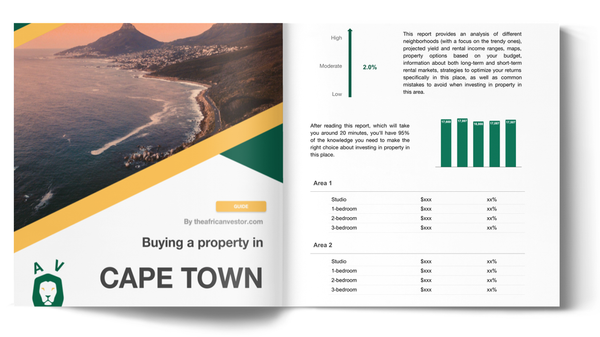
Cape Town offers diverse residential areas ranging from affluent Atlantic Seaboard neighborhoods to emerging suburban communities. Property prices, rental costs, and lifestyle amenities vary significantly across the city's distinct districts, from the trendy City Bowl to the family-friendly Southern Suburbs.
If you want to go deeper, you can check our pack of documents related to the real estate market in Cape Town, based on reliable facts and data, not opinions or rumors.
Cape Town's residential property market spans from premium Atlantic Seaboard areas with rental costs exceeding R25,000 monthly to affordable Northern Suburbs locations starting at R8,000 per month.
Property prices range from R15,000 to R95,000 per square meter depending on location, with the City Bowl and Atlantic Seaboard commanding premium prices while emerging areas offer growth potential.
| Area | Avg. 1-Bed Rent (R/month) | Property Price (R/sqm) | Safety Rating | Commute to City Center |
|---|---|---|---|---|
| City Bowl | R18,000-R28,000 | R55,000-R85,000 | Moderate | 5-15 minutes |
| Atlantic Seaboard | R25,000-R45,000 | R70,000-R95,000 | Good | 15-25 minutes |
| Southern Suburbs | R12,000-R22,000 | R35,000-R65,000 | Very Good | 20-35 minutes |
| Northern Suburbs | R8,000-R16,000 | R15,000-R35,000 | Good | 25-45 minutes |
| West Coast | R10,000-R18,000 | R25,000-R45,000 | Good | 30-50 minutes |

How much does it cost on average to rent a one-bedroom apartment in Cape Town's best areas?
Rental costs for one-bedroom apartments in Cape Town vary significantly depending on the specific area and proximity to amenities.
In the prestigious Atlantic Seaboard areas like Sea Point, Clifton, and Camps Bay, one-bedroom apartments typically rent for R25,000 to R45,000 per month as of September 2025. These premium locations offer ocean views, upscale dining, and proximity to beaches.
The City Bowl neighborhoods including Gardens, Tamboerskloof, and Oranjezicht command rental prices between R18,000 and R28,000 monthly. These central areas provide easy access to the CBD, cultural attractions, and Table Mountain hiking trails. Green Point and De Waterkant fall within the R20,000 to R32,000 range, benefiting from their proximity to the V&A Waterfront and stadium precinct.
Southern Suburbs areas such as Rondebosch, Claremont, and Constantia offer more affordable options at R12,000 to R22,000 per month. These family-friendly neighborhoods provide excellent schools, shopping centers, and wine estates access. Observatory and Woodstock, popular with young professionals, typically range from R10,000 to R18,000 monthly.
It's something we develop in our Cape Town property pack.
How much does it cost to buy property per square meter in Cape Town's prime areas?
Property purchase prices per square meter in Cape Town reflect the city's diverse geography and neighborhood characteristics.
Atlantic Seaboard properties command the highest prices, ranging from R70,000 to R95,000 per square meter in areas like Clifton, Bantry Bay, and Fresnaye. These locations offer unparalleled ocean views, luxury amenities, and proximity to high-end restaurants and beaches.
City Bowl properties typically cost between R55,000 and R85,000 per square meter, with premium locations like Upper Gardens and Oranjezicht reaching the higher end of this range. The central location provides easy access to business districts and cultural venues. Green Point and De Waterkant properties generally fall within the R50,000 to R70,000 per square meter bracket.
Southern Suburbs offer more moderate pricing at R35,000 to R65,000 per square meter, with established areas like Constantia and Bishopscourt commanding premium prices within this range. Rondebosch, Claremont, and Wynberg typically range from R35,000 to R50,000 per square meter. Northern Suburbs properties present the most affordable options at R15,000 to R35,000 per square meter, making them attractive for first-time buyers and investors seeking growth potential.
What is the average monthly cost of living in different Cape Town areas?
Monthly living costs in Cape Town vary considerably based on lifestyle choices and neighborhood selection.
| Expense Category | Budget Range (R/month) | Mid-Range (R/month) | Premium (R/month) |
|---|---|---|---|
| Groceries & Food | R3,500-R5,000 | R6,000-R8,500 | R9,000-R12,000 |
| Transport (Car/Uber) | R2,000-R3,500 | R4,000-R6,000 | R7,000-R10,000 |
| Utilities (Electricity/Water) | R800-R1,200 | R1,300-R2,000 | R2,200-R3,500 |
| Internet & Mobile | R600-R900 | R1,000-R1,400 | R1,500-R2,200 |
| Entertainment/Dining | R1,500-R2,500 | R3,000-R5,000 | R6,000-R10,000 |
| Insurance & Misc | R1,000-R1,500 | R1,800-R2,500 | R3,000-R4,000 |
| Total Monthly Cost | R9,400-R14,600 | R17,100-R25,400 | R28,700-R41,700 |
How safe are Cape Town's residential areas in terms of crime statistics?
Crime statistics in Cape Town vary significantly by neighborhood, with affluent areas generally experiencing lower crime rates than townships and informal settlements.
Atlantic Seaboard areas like Clifton, Camps Bay, and Sea Point maintain relatively low crime rates with approximately 15-25 incidents per 1,000 residents annually. These areas benefit from private security services, CCTV surveillance, and active community policing forums.
City Bowl neighborhoods including Gardens, Tamboerskloof, and Green Point experience moderate crime levels with roughly 25-35 incidents per 1,000 residents per year. Petty crimes like vehicle break-ins and opportunistic theft are more common than violent crimes. Southern Suburbs areas such as Constantia, Rondebosch, and Claremont typically report 20-30 incidents per 1,000 residents annually, with excellent neighborhood watch programs and private security presence.
Northern Suburbs communities like Bellville and Parow generally experience 30-45 incidents per 1,000 residents yearly, though violent crime remains relatively uncommon. Areas closer to informal settlements may experience higher property crime rates. Most established residential areas employ armed response services and access-controlled security measures.
It's something we develop in our Cape Town property pack.
Don't lose money on your property in Cape Town
100% of people who have lost money there have spent less than 1 hour researching the market. We have reviewed everything there is to know. Grab our guide now.

How long does it take to commute to Cape Town city center during rush hour?
Commute times to Cape Town's city center vary considerably based on location, transportation method, and traffic conditions during peak hours.
City Bowl residents enjoy the shortest commutes, typically ranging from 5 to 15 minutes by car or MyCiTi bus during rush hour. Areas like Gardens, Tamboerskloof, and Bo-Kaap provide walking or cycling access to most CBD destinations within 10-20 minutes.
Atlantic Seaboard areas require 15 to 25 minutes during peak traffic, with routes through Sea Point, Green Point, and the N1 highway. The MyCiTi rapid transit system connects these areas efficiently, though service frequency can affect total travel time. Southern Suburbs residents face 20 to 35-minute commutes via the M3 highway or Southern Line rail services, with areas like Rondebosch and Claremont benefiting from multiple transport options.
Northern Suburbs commuters typically spend 25 to 45 minutes reaching the city center during rush hours, primarily using the N1 and N7 highways. Peak traffic congestion can extend these times significantly, particularly from areas like Bellville and Parow. West Coast communities such as Milnerton and Table View generally require 30 to 50 minutes, depending on traffic conditions along the R27 and N1 routes.
What are the average school ratings and student-teacher ratios in Cape Town areas?
Cape Town's educational landscape varies significantly between government schools, private institutions, and international schools across different neighborhoods.
Southern Suburbs areas like Constantia, Rondebosch, and Claremont host some of Cape Town's most prestigious schools with average ratings of 4.2 to 4.8 out of 5. Top institutions like Herschel Girls' School, Bishops Diocesan College, and Rondebosch Boys' High maintain student-teacher ratios between 12:1 and 18:1. These schools typically charge annual fees ranging from R80,000 to R150,000.
City Bowl and Atlantic Seaboard neighborhoods provide access to quality private schools with ratings between 3.8 and 4.5. Schools like Cape Town High School and Herzlia High School maintain ratios of 15:1 to 22:1. Government schools in these areas generally achieve ratings of 3.2 to 3.8 with higher student-teacher ratios of 25:1 to 35:1.
Northern Suburbs areas offer a mix of quality government and private schools, with average ratings ranging from 3.5 to 4.2. Student-teacher ratios typically fall between 20:1 and 30:1 in government schools, while private institutions maintain 15:1 to 25:1 ratios. International schools across the city maintain exceptional standards with ratings above 4.5 and ratios below 15:1.
How many hospitals and clinics are located within 5km of Cape Town's residential areas?
Healthcare accessibility in Cape Town varies by neighborhood, with central areas offering the highest concentration of medical facilities.
City Bowl and Atlantic Seaboard residents have access to 8-12 major hospitals and medical centers within a 5km radius. These include Groote Schuur Hospital, Mediclinic Cape Town, and Vincent Pallotti Hospital. Private clinics and specialist practices number in the dozens, particularly concentrated around the medical precincts of Observatory and Gardens.
Southern Suburbs areas like Rondebosch, Claremont, and Constantia benefit from 6-10 major healthcare facilities within 5km, including Red Cross War Memorial Children's Hospital, Kingsbury Hospital, and numerous private clinics. The University of Cape Town medical precinct provides additional specialist services and research facilities.
Northern Suburbs communities typically have access to 4-8 major hospitals within a 5km radius, including Tygerberg Hospital, Mediclinic Panorama, and Louis Leipoldt Hospital. These areas also feature numerous day clinics and primary healthcare facilities serving local communities.
West Coast areas generally have access to 3-6 major healthcare facilities within 5km, with additional services available in nearby Goodwood and Elsies River. Emergency medical services maintain good response times across all major residential areas.
What is the average internet speed and fiber availability in Cape Town areas?
Internet infrastructure in Cape Town has improved significantly, with fiber availability now reaching most established residential areas as of September 2025.
Atlantic Seaboard and City Bowl areas enjoy comprehensive fiber coverage exceeding 90%, with average speeds ranging from 100 to 1,000 Mbps. Premium areas often have access to multiple service providers including Vumatel, Octotel, and MetroFibre, ensuring competitive pricing and reliable connectivity. Monthly costs typically range from R599 to R1,499 depending on speed requirements.
Southern Suburbs neighborhoods have fiber availability between 85-95%, with average speeds of 50 to 500 Mbps. Areas like Constantia, Rondebosch, and Claremont benefit from extensive infrastructure development, though some older residential areas may still rely on ADSL connections. Monthly fiber costs generally range from R499 to R999.
Northern Suburbs areas show improving connectivity with 70-85% fiber coverage, offering speeds between 25 and 200 Mbps in most locations. Newer developments typically feature fiber-ready infrastructure, while established areas continue upgrading from copper networks. West Coast communities have 60-80% fiber availability, with ongoing expansion programs targeting remaining areas.
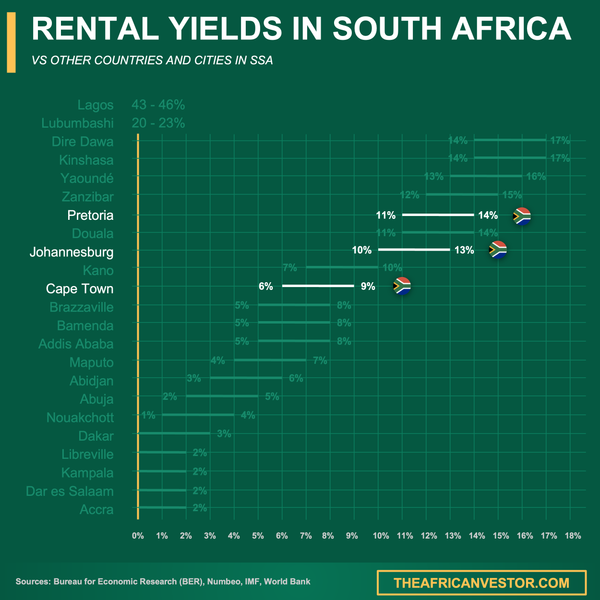
We did some research and made this infographic to help you quickly compare rental yields of the major cities in South Africa versus those in neighboring countries. It provides a clear view of how this country positions itself as a real estate investment destination, which might interest you if you're planning to invest there.
How many restaurants, cafes, and entertainment spots are within walking distance of Cape Town residential areas?
Entertainment and dining options vary dramatically across Cape Town's neighborhoods, with central areas offering the highest concentration of venues.
City Bowl areas like Long Street, Kloof Street, and Bree Street provide access to 50-100+ restaurants, cafes, and bars within walking distance. These neighborhoods feature diverse culinary scenes ranging from casual coffee shops to fine dining establishments, plus numerous galleries, theaters, and nightlife venues.
Atlantic Seaboard locations offer 30-80 dining and entertainment options within walking distance, with Sea Point Promenade, Camps Bay strip, and V&A Waterfront providing concentrated venue clusters. These areas specialize in upscale dining, cocktail bars, and ocean-view establishments.
Southern Suburbs areas typically have 15-40 restaurants and cafes within walking distance, concentrated around shopping centers like Cavendish Square, Claremont Central, and Constantia Village. These neighborhoods focus on family-friendly dining, wine farms, and suburban entertainment complexes.
Northern Suburbs communities generally offer 10-25 dining options within walking distance, primarily located in shopping malls like Tyger Valley Centre and Canal Walk. These areas emphasize chain restaurants, family venues, and cinema complexes rather than boutique establishments.
What is the average property value growth rate in Cape Town areas over the past 5 years?
Property value growth in Cape Town has shown varied performance across different neighborhoods between 2020 and 2025.
Atlantic Seaboard properties have demonstrated the strongest growth rates, averaging 6-8% annually over the five-year period. Premium areas like Clifton, Camps Bay, and Bantry Bay have benefited from international buyer interest and limited supply constraints. Some luxury properties have seen cumulative growth exceeding 45% since 2020.
City Bowl neighborhoods have achieved moderate growth rates of 4-6% annually, with areas like Gardens, Tamboerskloof, and Green Point showing consistent appreciation. The appeal of central living and urban regeneration projects has supported steady value increases across most City Bowl submarkets.
Southern Suburbs areas have experienced growth rates between 3-5% annually, with established neighborhoods like Constantia, Rondebosch, and Bishopscourt maintaining stable appreciation patterns. Family-oriented areas have benefited from consistent demand from local buyers and school proximity premiums.
Northern Suburbs properties have shown growth rates of 2-4% annually, with emerging areas like Durbanville and Kraaifontein occasionally outperforming established suburbs. West Coast communities have achieved 3-5% annual growth, driven by lifestyle migration and coastal development projects.
It's something we develop in our Cape Town property pack.
How many days per year do Cape Town areas experience strong winds, rain, or weather extremes?
Cape Town's Mediterranean climate brings distinct seasonal weather patterns that affect different areas of the city variably.
The entire Cape Town metropolitan area experiences strong southeasterly winds ("Cape Doctor") for approximately 45-60 days annually, typically between October and March. Atlantic Seaboard areas face the most intense wind exposure, with gusts frequently exceeding 60km/h during summer months.
Winter rainfall occurs primarily between May and August, with the city receiving rain on approximately 70-90 days annually. Southern Suburbs areas like Constantia and Rondebosch typically receive 15-20% more rainfall than northern areas due to their proximity to Table Mountain's orographic effects.
Northern Suburbs areas experience slightly less rainfall and wind intensity compared to southern and coastal neighborhoods. These areas see approximately 60-75 rainy days annually and face strong winds on 35-45 days per year. West Coast communities experience similar patterns but with increased wind exposure due to their coastal position.
Extreme weather events are relatively rare, with severe storms occurring 3-8 days annually. These typically involve heavy rain, hail, and strong winds that can cause localized flooding and power outages. Temperature extremes are uncommon, with fewer than 10 days annually exceeding 35°C or dropping below 5°C.
What is the average tourist density and seasonal influx of visitors in Cape Town areas?
Tourism patterns in Cape Town create significant seasonal variations in population density across different neighborhoods.
1. **Peak Season (December-February)**: Tourist numbers increase by 200-400% in central areas 2. **High Season (March-May, September-November)**: Moderate increases of 100-150% in visitor numbers 3. **Low Season (June-August)**: Tourist presence drops to 30-50% of peak levels 4. **Special Events**: New Year's Eve, Cape Town Cycle Tour, and festivals create temporary surges 5. **Cruise Season**: Summer months bring additional day visitors from cruise shipsAtlantic Seaboard areas experience the highest tourist concentrations, with Camps Bay, Clifton, and Sea Point seeing visitor numbers peak at 15,000-25,000 daily during December and January. These areas face significant congestion, parking shortages, and inflated restaurant prices during peak periods.
City Bowl neighborhoods, particularly the V&A Waterfront, Company's Garden, and Long Street precincts, accommodate 20,000-35,000 daily visitors during peak season. Tourist density can make daily activities challenging for residents, with crowded public spaces and extended wait times at popular venues.
Southern Suburbs areas experience moderate tourist impact, primarily from wine estate visitors and Kirstenbosch Botanical Gardens patrons. Daily visitor numbers typically range from 2,000-8,000 during peak periods, concentrated around specific attractions rather than distributed throughout residential areas.
Conclusion
This article is for informational purposes only and should not be considered financial advice. Readers are advised to consult with a qualified professional before making any investment decisions. We do not assume any liability for actions taken based on the information provided.
Cape Town's residential property market offers diverse opportunities across distinct neighborhoods, each with unique characteristics affecting investment potential and lifestyle quality.
From premium Atlantic Seaboard locations to emerging Northern Suburbs communities, buyers and investors can find options matching various budgets, preferences, and growth expectations.