Authored by the expert who managed and guided the team behind the South Africa Property Pack
Yes, the analysis of Cape Town's property market is included in our pack
Cape Town property prices have surged 8.5% in the past year, far outpacing national averages and Johannesburg's modest 2.3% growth.
While talk of a market crash persists, current data shows strong foreign investment, robust local demand from semigration, and limited prime property supply supporting continued price appreciation through 2025 and 2026.
If you want to go deeper, you can check our pack of documents related to the real estate market in South Africa, based on reliable facts and data, not opinions or rumors.
Cape Town's residential property market continues to show strong fundamentals with 8.5% year-on-year price growth as of September 2025, driven by foreign buyer demand and local semigration.
Despite infrastructure challenges and affordability concerns, economists forecast 3-7% annual appreciation through 2026, making a market crash unlikely in the near term.
| Market Indicator | Current Status (Sept 2025) | Trend Direction |
|---|---|---|
| Price Growth (Annual) | 8.5% (vs 5.2% nationally) | Moderating but positive |
| Foreign Investment | 67% of Atlantic Seaboard sales | Increasing |
| Interest Rates | Prime at 10.75% | Declining from 2023-24 peaks |
| Average Rental Yields | 5.2% city-wide, 8%+ central | Stable |
| Distressed Sales | Below 2022-23 levels | Declining |
| Supply vs Demand | Demand exceeding supply | Continued imbalance |
| 2026 Price Forecast | 3-7% annual growth | Moderate appreciation |

How have Cape Town property prices changed over the past 12 months, and are they rising or falling right now?
Cape Town residential property prices have increased by 8.5% year-on-year as of September 2025, significantly outperforming the national average of 5.2% and Johannesburg's modest 2.3% growth.
The Atlantic Seaboard suburbs including Clifton, Camps Bay, Bantry Bay, and Sea Point have recorded even stronger performance with double-digit annual price increases. This exceptional growth stems from extremely limited supply in these prime coastal areas and sustained demand from both local and international buyers.
As of September 2025, market momentum remains positive through the third quarter, with price increases continuing across most suburbs. The upward trend shows no immediate signs of reversal, though economists predict growth will moderate to a more sustainable 3-7% annually in the coming years.
The strong price performance reflects Cape Town's appeal as both a lifestyle destination and investment haven, driven by semigration from other South African provinces and robust foreign buyer activity.
What are the current average prices per square meter in key Cape Town suburbs like Sea Point, Claremont, and Durbanville?
Property prices per square meter vary significantly across Cape Town's key suburbs, with Sea Point commanding the highest prices followed by Claremont and Durbanville.
| Suburb | Apartments (R/m²) | Houses (R/m²) |
|---|---|---|
| Sea Point | R32,000 - R60,000 | R40,000+ |
| Claremont | R25,000 - R35,000 | R25,000 - R30,000 |
| Durbanville | R18,000 - R27,000 | R18,000 - R22,000 |
| City Bowl (avg) | R28,000 - R45,000 | R35,000 - R50,000 |
| Camps Bay | R45,000 - R80,000 | R60,000+ |
| Bellville | R15,000 - R22,000 | R16,000 - R20,000 |
| Rondebosch | R22,000 - R32,000 | R24,000 - R28,000 |
How many properties are currently on the market compared to last year, and has time-to-sell increased?
The number of residential properties listed on the Cape Town market is moderately lower than the same period last year, reflecting strong absorption rates in desirable suburbs.
Central and sought-after suburban areas report vacancy rates well below national averages, often under 10%. This reduced inventory stems from robust local migration patterns and sustained foreign demand, which continue to absorb available stock quickly.
Time-to-sell for prime and well-priced properties has remained steady or even decreased in top-performing suburbs like the Atlantic Seaboard and southern suburbs. Properties in Sea Point, Claremont, and similar desirable areas are moving as quickly as in 2024, despite broader affordability pressures affecting the market.
However, less desirable properties or those priced above market value are experiencing longer selling periods compared to 2023. The market has become more selective, with buyers increasingly focused on location, condition, and value proposition.
It's something we develop in our South Africa property pack.
What is the latest rental yield data across central Cape Town versus the northern and southern suburbs?
Rental yields across Cape Town vary significantly by location, with central areas generally offering higher returns than established suburban markets.
The average gross rental yield city-wide stands at approximately 5.2% as of September 2025. Central Cape Town areas including the City Bowl, Woodstock, and Salt River deliver yields exceeding 8% for compact apartments and properties in emerging regeneration hubs.
Northern suburbs like Durbanville and Bellville, along with established southern suburbs such as Claremont and Rondebosch, typically generate yields in the 4.5-6% range. These areas offer more stable, long-term rental income but lower initial returns due to higher property prices.
The higher yields in central areas reflect both the urban regeneration happening in these neighborhoods and the strong rental demand from young professionals and students. Properties near transport hubs and universities command premium rental rates, boosting overall yield calculations.
Don't lose money on your property in Cape Town
100% of people who have lost money there have spent less than 1 hour researching the market. We have reviewed everything there is to know. Grab our guide now.

Are distressed sales or repossessions increasing in Cape Town, and by how much compared to 2022 and 2023?
Distressed sales and repossessions in Cape Town are not showing significant increases and have actually remained flat or declined from the peaks experienced in 2022-2023.
The current market environment does not exhibit characteristics of widespread financial distress among property owners. Lower interest rates implemented since late 2024 and improved buyer activity have contributed to this stability.
Job recovery in the Western Cape has been stronger than in other South African provinces, supporting homeowner ability to maintain mortgage payments. The province's economic resilience, driven by tourism, agriculture, and service sectors, has helped prevent the wave of foreclosures that some analysts predicted.
Banks report that mortgage delinquency rates have stabilized, and the combination of lower interest rates and increased buyer demand has provided property owners with more options to avoid distressed sales through normal market transactions.
How are interest rates in South Africa affecting mortgage affordability for Cape Town buyers this year?
Interest rates have become more favorable for Cape Town property buyers in 2025, following a series of cuts from the peaks reached in 2023-2024.
The South African Reserve Bank's repo rate currently sits at 7.75%, with prime lending rates at 10.75% as of the third quarter of 2025. These rates represent a meaningful reduction from the higher levels seen in the previous year.
Lower interest rates have improved affordability metrics, with home loan applications increasing by over 10% compared to 2024. More buyers are now able to qualify for financing, particularly in the mid-market segment where the rate reductions have the most significant impact on monthly payments.
Despite these improvements, affordability remains challenging for entry-level homebuyers due to the combination of rising property prices, increased municipal rates, and substantial deposit requirements. The rate cuts have helped, but haven't fully offset the impact of Cape Town's strong price appreciation.
What do the banks' current lending conditions look like—are deposits higher, and approval rates lower than before?
South African banks have maintained relatively strict lending criteria while showing some improvement in approval rates during the second and third quarters of 2025.
Deposit requirements have increased slightly, particularly for foreign buyers and first-time purchasers, typically ranging from 10-30% depending on the buyer's profile and property type. Banks are requiring larger deposits as a risk management measure given the elevated property prices in Cape Town.
Approval rates have actually improved in 2025 compared to the previous year, driven by lower interest rates and increased buyer confidence in the market. However, banks continue to apply stringent credit vetting processes, especially for high-risk borrower profiles.
Foreign buyers face additional scrutiny and documentation requirements, often needing to provide comprehensive income verification and larger deposits. Local buyers with stable employment and good credit histories are finding the approval process more favorable than in 2023-2024.
It's something we develop in our South Africa property pack.
How many new property developments are under construction or approved in Cape Town right now, and is supply outpacing demand?
Cape Town has numerous new developments underway or recently approved, but demand continues to outpace new supply across most market segments as of September 2025.
Major development activity is concentrated in decentralized nodes and emerging suburbs, with significant mixed-use projects planned for areas like Athlone, Maitland, and Bellville. The central city is also seeing substantial mixed-use developments that combine residential, retail, and office components.
Despite this development pipeline, the supply-demand imbalance persists, particularly in the luxury and upper mid-market segments where land constraints are most severe. The Atlantic Seaboard and established southern suburbs face geographic limitations that prevent significant supply expansion.
Affordable housing development continues to lag behind luxury and middle-market projects, creating ongoing supply shortages in the entry-level segment. This imbalance contributes to the sustained price pressure across Cape Town's residential market.
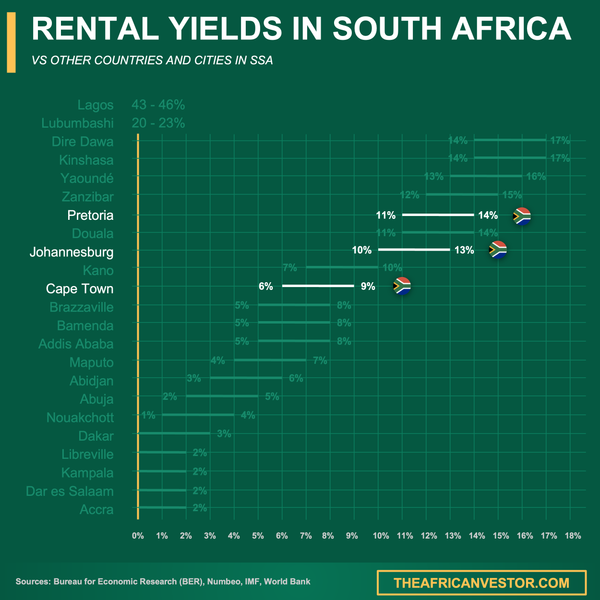
We did some research and made this infographic to help you quickly compare rental yields of the major cities in South Africa versus those in neighboring countries. It provides a clear view of how this country positions itself as a real estate investment destination, which might interest you if you're planning to invest there.
What are local and foreign buyer trends—are international investors pulling back or increasing purchases in Cape Town?
Foreign buyer activity in Cape Town has surged dramatically in 2025, showing no signs of the pullback seen in other international markets.
International investors now account for up to 67% of sales in top-end Atlantic Seaboard areas, with over R1 billion in foreign sales recorded in just the first five months of 2025. This represents a significant increase from previous years and demonstrates Cape Town's growing appeal as a global investment destination.
Local demand remains robust, driven primarily by continued semigration - internal migration from other South African provinces. Buyers from Johannesburg, Durban, and other major cities continue to relocate to Cape Town, seeking perceived lifestyle benefits, better governance, and employment opportunities.
The combination of foreign investment and domestic migration creates a dual demand pressure that supports price growth. Foreign buyers are particularly active in the luxury coastal properties, while local semigrants tend to focus on family homes in the northern and southern suburbs.
What impact is load-shedding, water shortages, and municipal service reliability having on Cape Town property values?
Infrastructure challenges including load-shedding and service reliability issues are creating both headwinds and opportunities in Cape Town's property market.
Ongoing load-shedding and water reliability concerns are driving increased demand for eco-friendly, off-grid, and water-wise properties. Buyers are increasingly willing to pay premiums for homes with solar power systems, battery storage, and water independence features.
Property values in suburbs that demonstrate resilience to infrastructure outages or have invested in independent supply systems are performing better than the market average. High-end buyers particularly factor municipal service quality into their purchasing decisions.
Conversely, some downward price pressure affects properties in poorly serviced districts where infrastructure challenges are most severe. However, Cape Town's overall desirability as a destination continues to outweigh these concerns for most buyers.
The market is adapting by pricing in infrastructure solutions, with properties featuring backup power and water systems commanding significant premiums over conventional homes.
How do Cape Town's price-to-income ratios compare with Joburg, Durban, and international coastal cities in 2025?
Cape Town maintains the highest price-to-income ratio in South Africa and now compares with mid-tier international coastal cities.
Current estimates place Cape Town's city-center price-to-income ratio at 11-14 times annual income, significantly higher than Johannesburg's ratio of less than 9 times and well above Durban's levels. This positions Cape Town as the least affordable major city in South Africa for local buyers.
Internationally, Cape Town's ratios are now similar to cities like Lisbon and Barcelona, reflecting its emergence as a globally recognized coastal destination. However, it remains more affordable than tier-one international cities like Sydney, San Francisco, or London.
The high ratio relative to local incomes creates affordability challenges for domestic buyers but reflects the city's appeal to international investors and high-net-worth individuals who view Cape Town as offering exceptional value compared to similar coastal destinations worldwide.
It's something we develop in our South Africa property pack.
What do property economists and major real estate agencies forecast for Cape Town prices over the next 12 to 24 months?
Property economists and major real estate agencies are forecasting continued but moderated price appreciation for Cape Town over the next 12-24 months.
The consensus forecast predicts 3-7% annual price appreciation through 2026, with prime submarkets likely to outperform the citywide average. This represents a moderation from the current 8.5% growth rate but still indicates solid real returns for property investors.
Prime coastal areas and sought-after suburban locations are expected to maintain stronger growth momentum due to supply constraints and sustained high-end demand. The Atlantic Seaboard and established southern suburbs may continue to see above-average appreciation.
Key risks to these forecasts include potential affordability ceilings that could limit buyer demand, possible regulation of short-term rental markets, and rising municipal rates. However, underlying factors including limited land supply, continued semigration, and foreign investment provide fundamental support for ongoing price growth.
Most analysts believe a significant market crash is unlikely given the strong demand fundamentals and supply constraints that characterize Cape Town's residential market.
Conclusion
This article is for informational purposes only and should not be considered financial advice. Readers are advised to consult with a qualified professional before making any investment decisions. We do not assume any liability for actions taken based on the information provided.
Cape Town's property market shows little indication of an impending crash, with strong fundamentals supporting continued price appreciation through 2025 and 2026.
While affordability challenges persist for local buyers, robust foreign investment, ongoing semigration, and limited supply in prime areas create a supportive environment for property values.
Sources
- The AfricanVestor - Cape Town Price Forecasts
- The AfricanVestor - Average House Price Cape Town
- RP Realty Plus - Cape Town Leads House Price Growth
- ImmoAfrica - Sea Point Property Guide 2025
- IOL - Cape Town Property Market Outpaces SA
- The AfricanVestor - Cape Town Property
- FindMy - South Africa Property Market 2025
- Ooba - Property Market South Africa
- Lightstone - Property Newsletter April 2025
- WiseMove - Cost of Living Cape Town