Authored by the expert who managed and guided the team behind the South Africa Property Pack
Yes, the analysis of Cape Town's property market is included in our pack
Cape Town's property rental yields in 2025 present a compelling yet complex picture for investors, with gross yields ranging from 6% to 12% depending on location and property type.
As of September 2025, Cape Town's residential property market offers investors gross rental yields of 10.5-11% for apartments, though realistic expectations settle around 7-8% for gross yields, with net yields substantially lower after deductions. Prime neighborhoods like Sea Point, Green Point, and Camps Bay deliver 6-9% gross yields due to higher property prices, while emerging areas like Woodstock and Observatory can achieve 8-12% gross yields thanks to lower purchase costs and strong tenant demand.
If you want to go deeper, you can check our pack of documents related to the real estate market in South Africa, based on reliable facts and data, not opinions or rumors.
Cape Town rental yields range from 7-8% gross in prime areas to 8-12% in emerging neighborhoods, with net yields typically 4-7% after costs.
Short-term rentals through platforms like Airbnb can achieve 10-15% yields but require active management and carry regulatory risks.
| Area Type | Gross Yield Range | Net Yield After Costs | Property Price per sqm |
|---|---|---|---|
| Prime Atlantic Seaboard | 6-9% | 4-6% | R65,000-R127,000 |
| City Centre/City Bowl | 7-9% | 5-7% | R28,000-R35,000 |
| Emerging Areas (Woodstock/Observatory) | 8-12% | 5-10% | R20,000-R32,000 |
| Short-term Rentals (All Areas) | 10-15%+ | 7-12% | Varies by location |
| Southern Suburbs | 7-10% | 5-8% | R25,000-R40,000 |

What are the current gross rental yields for apartments and houses in Cape Town?
Cape Town's residential property market delivers gross rental yields of 10.5-11% for apartments as of September 2025, though more realistic expectations center around 7-8% for most properties.
Houses typically achieve slightly lower gross yields than apartments, ranging from 6-9% depending on location and property condition. Sectional title apartments in good areas consistently outperform freehold houses due to lower maintenance costs and higher tenant demand.
The variation in yields depends heavily on property age, with newer developments in sought-after areas commanding premium rents but also carrying higher purchase prices. Older properties in well-established neighborhoods can deliver higher yields but require more maintenance investment.
These gross yield figures represent rental income before deducting any costs such as levies, rates, management fees, or maintenance expenses.
How do prime neighborhoods compare to emerging areas for rental yields?
Prime neighborhoods like Sea Point, Green Point, and Camps Bay deliver gross yields of 6-9%, significantly lower than emerging areas due to their premium property prices.
| Neighborhood Type | Gross Yield Range | Average Property Price | Rental Demand |
|---|---|---|---|
| Sea Point/Green Point | 6-8% | R65,000-R85,000/sqm | Very High |
| Camps Bay/Clifton | 6-7% | R85,000-R127,000/sqm | High (Seasonal) |
| Woodstock | 8-11% | R25,000-R35,000/sqm | High |
| Observatory | 9-12% | R20,000-R30,000/sqm | High (Students/Professionals) |
| Salt River | 8-10% | R22,000-R32,000/sqm | Growing |
Emerging areas like Woodstock and Observatory achieve 8-12% gross yields because of significantly lower property purchase prices combined with strong rental demand from young professionals and students. These areas benefit from urban regeneration and proximity to the city center.
Prime Atlantic Seaboard properties offer prestige and capital growth potential but sacrifice yield for luxury positioning and ocean views.
What is the realistic net yield after deducting all costs?
Net rental yields in Cape Town typically range from 4-7% after deducting levies, municipal rates, management fees, and maintenance costs.
Levies for sectional title properties cost R15-50 per square meter monthly, while municipal rates increased by 8-20% in 2025 for high-value homes. Property management fees consume 8-12% of gross rental income when using professional management companies.
Maintenance costs vary significantly between property types, with older properties requiring 2-4% of property value annually for upkeep. Insurance, repairs, and vacancy periods further reduce net yields by approximately 1-2%.
Prime properties in luxury developments often experience the largest gap between gross and net yields due to higher levies and maintenance standards.
Investors should budget for total deductions of 1.5-3% from gross yield when calculating realistic returns on Cape Town property investments.
How does Cape Town compare to Johannesburg and Durban for rental yields?
Cape Town delivers competitive but generally lower rental yields compared to Johannesburg and Durban due to higher property prices relative to rental income.
| City | Average Gross Yield | Long-term Rental Yield | Short-term Rental Potential |
|---|---|---|---|
| Cape Town | 7-11% | 7-8% | 10-15% |
| Johannesburg | 10-13% | 11-12% | 12-16% |
| Durban | 8-13% | 8-9% | 10-15% |
| Pretoria | 9-12% | 9-10% | 11-14% |
| Port Elizabeth | 10-14% | 10-11% | 12-16% |
Johannesburg consistently delivers the highest rental yields among South Africa's major cities, with gross yields of 10-13% due to significantly lower property prices and strong rental demand from business travelers and relocating professionals.
Cape Town compensates for lower yields with superior capital growth potential, lifestyle appeal, and international tenant demand, making it attractive for long-term wealth building rather than pure income generation.
It's something we develop in our South Africa property pack.
Don't lose money on your property in Cape Town
100% of people who have lost money there have spent less than 1 hour researching the market. We have reviewed everything there is to know. Grab our guide now.

What are the average property purchase prices per square meter in 2025?
Property prices in Cape Town's central city and City Bowl range from R28,000-R35,000 per square meter for modern units as of September 2025.
Atlantic Seaboard properties command premium prices of R65,000-R127,000 per square meter, with ultra-luxury units in Clifton and Bantry Bay exceeding R100,000 per square meter. Sea Point and Green Point typically price between R65,000-R85,000 per square meter.
Emerging neighborhoods offer more affordable entry points, with Woodstock and Observatory properties priced at R20,000-R32,000 per square meter for both entry-level and upmarket new developments.
Southern Suburbs properties generally price between R25,000-R40,000 per square meter, depending on specific location and property quality.
These prices reflect the significant premium investors pay for ocean proximity and established infrastructure in Cape Town's most desirable areas.
What are the average monthly rental rates for different unit sizes?
One-bedroom apartments in Cape Town's CBD and Sea Point achieve monthly rentals of R12,000-R18,000 as of September 2025.
| Unit Type & Location | Monthly Rent (ZAR) | Target Tenant Market |
|---|---|---|
| 1-bedroom (CBD/Sea Point) | R12,000-R18,000 | Young professionals |
| 2-bedroom (CBD/Atlantic Seaboard) | R18,000-R35,000 | Couples/small families |
| 3-bedroom (Southern Suburbs) | R20,000-R35,000 | Families |
| 1-bedroom (Woodstock/Observatory) | R8,000-R13,000 | Students/young professionals |
| Luxury 3-bedroom+ (Atlantic Seaboard) | R30,000-R100,000+ | Executives/luxury market |
Two-bedroom units in the CBD and Atlantic Seaboard command R18,000-R35,000 monthly, while three-bedroom units in the Southern Suburbs achieve R20,000-R35,000 per month. Emerging areas like Woodstock and Observatory offer more affordable options, with one-bedroom units renting for R8,000-R13,000 monthly.
Luxury three-bedroom and larger units along the Atlantic Seaboard can achieve R30,000-R100,000+ monthly rentals, targeting high-net-worth individuals and corporate executives.
How do short-term rentals compare to traditional long-term rentals for yields?
Short-term rentals through platforms like Airbnb achieve gross yields of 10-15%+ in Cape Town, significantly outperforming traditional long-term rentals.
Well-managed Airbnb properties generate average daily rates of R1,600-R1,800 per night (approximately $90), with median occupancy rates of 71% across Cape Town during 2024-2025. Tourist-heavy areas like Camps Bay and Sea Point achieve higher occupancy rates of 65-75%.
Short-term rentals require active management, professional cleaning services, and higher insurance costs, which can reduce net yields to 7-12% depending on operational efficiency. Seasonal fluctuations significantly impact occupancy, with summer months delivering peak performance.
Long-term rentals provide stable monthly income with lower management requirements but typically cap at 7-8% gross yields in most Cape Town neighborhoods.
Regulatory risks for short-term rentals include potential future restrictions, especially in seafront apartment developments where body corporates may impose limitations.
How stable are occupancy rates in different Cape Town areas?
Tourist areas along the Atlantic Seaboard and CBD maintain occupancy rates of 65-75% on average, with significant seasonal variation peaking during summer months.
Emerging neighborhoods like Woodstock and Observatory experience slightly lower but rising occupancy rates of 55-68% due to growing demand from students and young professionals. These areas benefit from year-round academic cycles and urban development momentum.
Purely residential zones in the Southern Suburbs offer more stability throughout the year with less dramatic seasonal swings, though they typically achieve lower peak rental rates than tourist-focused areas.
Short-term rental occupancy depends heavily on property quality, pricing strategy, and professional management, with well-positioned properties achieving 75%+ occupancy during peak seasons.
Long-term rental markets maintain more consistent occupancy above 90% but offer limited upside during peak tourism periods.
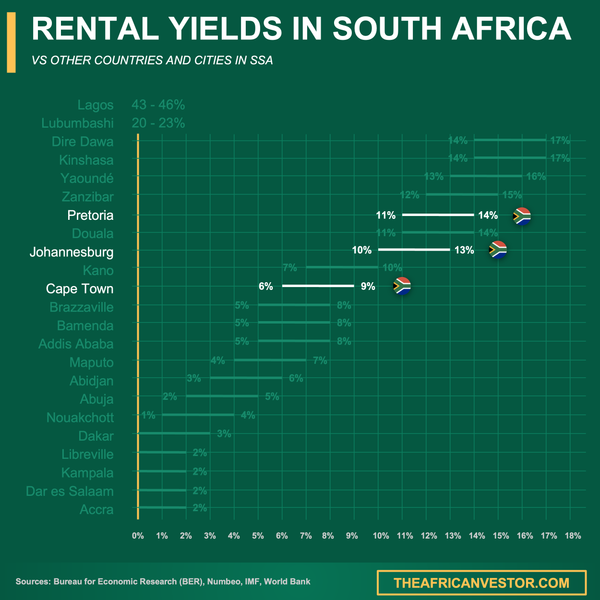
We did some research and made this infographic to help you quickly compare rental yields of the major cities in South Africa versus those in neighboring countries. It provides a clear view of how this country positions itself as a real estate investment destination, which might interest you if you're planning to invest there.
What financing costs and mortgage rates affect yield calculations?
South Africa's prime lending rate stands at 10.50% as of August 2025, following a rate cut in July 2025.
Typical home loan rates for property investors range from 10.0-10.5% for creditworthy buyers, with some exceptional cases securing marginally lower rates. First-time buyers and those with strong credit profiles may access rates closer to prime, while investment properties often attract higher rates.
Bond repayments and interest costs must be factored into yield calculations, significantly impacting net returns for leveraged property investments. A R2 million property purchased with 80% financing at 10.25% interest requires monthly bond payments of approximately R17,800.
Additional financing costs include bond registration fees, transfer duties, and legal costs, which typically add 8-12% to the property purchase price for investors.
Cash buyers avoid financing costs but sacrifice leverage potential and liquidity for higher net yields on their invested capital.
How do annual capital growth rates affect total investment returns?
Cape Town property achieved 8.5% year-on-year price growth in 2025, driven by lifestyle migration, limited supply, and luxury market demand.
Typical mid-range properties experience 5-8% annual capital appreciation, while super-prime luxury nodes have seen 15-30% growth, though these outlier gains are not sustainable long-term. Prime Atlantic Seaboard properties consistently outperform the broader market for capital growth.
Total investment returns combine rental yields with capital appreciation, often delivering 12-16% annual returns for well-selected Cape Town properties when both components perform strongly.
Capital growth potential in emerging areas like Woodstock and Observatory may exceed established neighborhoods due to urban regeneration and infrastructure development, though this carries higher risk.
It's something we develop in our South Africa property pack.
Long-term capital appreciation typically outweighs rental yields for wealth building, making Cape Town attractive despite lower initial yields compared to other South African cities.
What local risks could reduce achievable rental yields?
Load shedding continues disrupting Cape Town properties in 2025, increasing costs for backup power systems and solar installations while potentially deterring some tenants.
1. **Infrastructure Risks**: Load shedding, water shortages, and municipal service delivery issues 2. **Regulatory Changes**: Potential Airbnb restrictions, rent control measures, and zoning law changes 3. **Economic Factors**: Currency volatility, interest rate fluctuations, and economic recession impacts 4. **Property-Specific Risks**: Rising municipal rates (8-20% increases in 2025), escalating body corporate levies 5. **Market Saturation**: Oversupply in certain segments, particularly luxury short-term rental marketsWater shortage risks have been largely mitigated by infrastructure upgrades but remain a latent concern during severe drought periods. Municipal rates and levies are rising at 8-20% annually for high-value homes, directly impacting net yields in luxury districts.
Airbnb regulations remain relatively lenient but face increasing scrutiny, with potential future caps especially in seafront developments where body corporates may impose restrictions.
Crime and security concerns in certain areas can impact rental demand and necessitate additional security expenses, reducing net yields.
Currency weakness affects international tenant demand and purchasing power, while economic instability can reduce local rental demand and rental escalation rates.
What tax obligations affect net rental yields for investors?
All rental income in South Africa is taxed as ordinary income under progressive tax rates ranging from 18% up to 45% for high earners.
Allowable tax deductions include mortgage interest payments, municipal rates and taxes, body corporate levies, property management fees, repairs, maintenance costs, and insurance premiums. These deductions can significantly reduce taxable rental income.
Effective tax drag typically reduces net cash flow by 20-30% unless tax affairs are efficiently structured with proper deduction planning. High-income investors face the maximum 45% marginal tax rate on rental profits.
Capital gains tax applies at 40% of the gain for individuals (18% effective rate) and 80% of the gain for companies (22.4% effective rate) when properties are sold.
It's something we develop in our South Africa property pack.
Professional tax planning and proper record-keeping of allowable expenses are essential for maximizing after-tax rental yields in Cape Town property investments.
Conclusion
This article is for informational purposes only and should not be considered financial advice. Readers are advised to consult with a qualified professional before making any investment decisions. We do not assume any liability for actions taken based on the information provided.
Cape Town's rental yield landscape offers compelling opportunities for investors willing to navigate the complexities of location selection, cost management, and risk mitigation.
While gross yields of 7-12% are achievable depending on area and strategy, realistic net yields of 4-8% after all costs require careful property selection and active management to maximize returns.
Sources
- Global Property Guide - South Africa Rental Yields
- The Africanvestor - Cape Town Property Market
- LinkedIn - Cape Town Real Estate Statistics 2025
- Celsa Properties - Cape Town Rental Market Trends
- The Africanvestor - Average Rent Cape Town
- Property24 - Atlantic Seaboard Luxury Market
- Airbtics - Airbnb Revenue Cape Town
- iGrow - Interest Rate Impact Property Investors