Authored by the expert who managed and guided the team behind the South Africa Property Pack
Yes, the analysis of Cape Town's property market is included in our pack
Sea Point and Green Point represent two of Cape Town's most competitive property investment destinations, each offering distinct advantages for both investors and residents.
Sea Point delivers stronger rental yields of 6-9% compared to Green Point's 6-7%, while Green Point commands higher average property prices at R40,000-R65,000 per square meter versus Sea Point's R35,000-R70,000 range. Both neighborhoods maintain excellent liquidity with properties selling within 30-127 days, though Sea Point offers direct ocean frontage that significantly boosts long-term value appreciation.
If you want to go deeper, you can check our pack of documents related to the real estate market in South Africa, based on reliable facts and data, not opinions or rumors.
Sea Point offers better rental yields and direct ocean access, while Green Point provides premium pricing and proximity to major attractions.
Both areas show strong investment fundamentals with expected 4-5% annual price growth over the next five years.
| Investment Factor | Sea Point | Green Point |
|---|---|---|
| Average Price per sqm (Apartments) | R35,000-R70,000 | R40,000-R65,000 |
| Rental Yield Range | 6-9% | 6-7% |
| Days on Market | 96-127 days | 30-50 days |
| Monthly Levies | R2,500-R5,000 | R2,500-R5,000 |
| Crime Safety Rating | 9/10 | 8.5/10 |
| Ocean Proximity | Direct promenade frontage | Near ocean, Waterfront adjacent |
| 5-Year Growth Outlook | 4-5% annually | 4-5% annually |

How have property prices in Sea Point compared to Green Point over the past five years, and what is the current average price per square meter in each?
Sea Point property prices have increased by 8-12% annually over the past five years, maintaining consistent demand particularly for apartments.
Green Point has experienced more dramatic price movements, with luxury apartment prices doubling between 2018 and 2023. The area has seen several price spikes driven by new developments and luxury units entering the market.
As of September 2025, current average prices per square meter show Green Point commanding a premium in the apartment segment. Sea Point apartments range from R35,000 to R70,000 per square meter, while houses cost R30,000 to R60,000 per square meter. Green Point apartments cost R40,000 to R65,000 per square meter, with houses priced at R35,000 to R55,000 per square meter.
The price difference reflects Green Point's positioning as a more premium location with newer developments, while Sea Point offers better value for money with its established market and direct ocean access.
Both areas maintain prices firmly in Cape Town's upper market segment, attracting international investors and affluent local buyers.
What is the average rental yield in Sea Point versus Green Point right now, and how has demand for rentals changed in the past two years?
Sea Point currently delivers superior rental yields ranging from 6% to 9%, with high-end properties achieving up to 12% for well-managed short-term rentals.
Green Point offers slightly lower yields, typically ranging from 6% to 7% for luxury apartments. However, the area benefits from robust long-term rental demand and strong Airbnb performance due to tourist appeal and proximity to major attractions.
Rental demand has strengthened significantly in both areas over the past two years. Low vacancy rates persist across both neighborhoods, with consistent tenant interest from professionals, semigrants, and international renters driving competition for quality properties.
The short-term rental market remains particularly strong in both areas, though Sea Point's direct beach access gives it an edge for tourist bookings. Green Point compensates with its proximity to the V&A Waterfront and Cape Town Stadium.
It's something we develop in our South Africa property pack.
How quickly do properties sell in Sea Point compared to Green Point, and what is the average time a property stays on the market in each?
Green Point properties sell faster than Sea Point, with many well-priced homes selling within 30 days and most units moving within 30-50 days on the market.
Sea Point properties typically spend 96-127 days on the market, reflecting the sectoral average but still showing healthy demand. The longer marketing period allows for better price optimization and attracts serious buyers.
Both areas experience high competition for desirable listings, with well-located properties often receiving multiple offers. Properties with ocean views or premium finishes tend to sell at or above asking price after brief negotiations.
The faster sales in Green Point reflect its premium positioning and the urgency among buyers to secure properties in this limited-supply market. New developments often sell off-plan, reducing available resale stock.
Both neighborhoods maintain excellent liquidity compared to other Cape Town areas, making them attractive for investors who may need to exit their positions relatively quickly.
What types of properties are most in demand in each area, and how does supply meet that demand?
| Property Type | Sea Point Demand | Green Point Demand |
|---|---|---|
| Apartments | Very High - International investors and professionals | Very High - Luxury seekers and short-term rental investors |
| Penthouses | High - Ocean view premium | High - Modern luxury developments |
| Family Homes | Moderate - Limited by density | Moderate - Constrained supply |
| Townhouses | Moderate - Few new developments | High - New complex developments |
| New Developments | High - Mixed-use buildings | Very High - Luxury complexes |
Don't lose money on your property in Cape Town
100% of people who have lost money there have spent less than 1 hour researching the market. We have reviewed everything there is to know. Grab our guide now.

How much new development is happening in Sea Point and Green Point, and is it likely to put pressure on resale values or rental prices?
Both Sea Point and Green Point have significant new development pipelines, particularly focusing on mixed-use and luxury apartment complexes.
Green Point's Three Anchor Bay area leads new development activity, with several large mixed-use projects under construction. These developments include luxury apartments, retail spaces, and recreational facilities that are resetting local market benchmarks.
Sea Point has multiple luxury apartment buildings under construction, adding to the area's already dense apartment stock. These new buildings typically feature modern amenities and premium finishes targeting affluent buyers.
The new supply may moderate future resale value growth and create some pressure on rental prices, especially in apartment-heavy areas where competition increases. However, overall demand remains strong due to lifestyle appeal and zoning constraints that limit further development.
Developers focus on luxury segments, which may actually support rather than undermine existing property values by elevating the overall market positioning of both neighborhoods.
What are the typical monthly costs for levies, utilities, and maintenance in Sea Point versus Green Point?
Monthly levies in both Sea Point and Green Point range from R2,500 to R5,000 for sectional title apartments, depending on building amenities and security features.
Utility costs average R1,800 to R2,800 monthly for water, electricity, and sanitation services. These costs remain consistent across both areas due to municipal rate structures.
Maintenance expenses typically run R500 to R1,500 monthly for standard properties, with luxury units or homes featuring pools, gardens, or elevators requiring higher budgets.
Both areas benefit from established infrastructure and municipal services, keeping utility costs predictable. However, luxury developments with extensive amenities like gyms, pools, and 24-hour security command higher levy fees.
Investors should budget approximately R5,000 to R8,000 monthly for total holding costs on a standard apartment, not including bond repayments or rates and taxes.
How safe are both neighborhoods according to recent crime statistics, and are there visible trends in security improvements or concerns?
Sea Point maintains a crime safety rating of 9/10, classified as "Moderate-High" risk with strong private security presence throughout the area.
Green Point scores slightly better at 8.5/10 on crime safety ratings, with similar security infrastructure and community watch programs. Both areas benefit from enhanced security initiatives and good street lighting.
Crime in both neighborhoods typically involves petty theft rather than serious incidents. The main streets and promenade areas remain generally safe, particularly during daylight hours and early evening.
Visible security improvements include increased private security patrols, improved CCTV coverage, and active community watch groups. Many apartment buildings feature 24-hour security and controlled access systems.
Both areas benefit from high foot traffic and active street life, which naturally deters criminal activity. The proximity to tourist areas ensures regular police presence and municipal attention to safety concerns.
How do transport links and commuting options compare between Sea Point and Green Point, especially regarding access to Cape Town CBD and MyCiTi routes?
Both Sea Point and Green Point offer excellent MyCiTi bus connectivity with direct routes to Cape Town CBD and along the Atlantic Seaboard corridor.
Green Point benefits from slightly superior transport access due to its central location between the CBD and Waterfront, with multiple MyCiTi routes converging in the area. The Cape Town Stadium station serves as a major transport hub.
Sea Point provides direct highway access and efficient traffic management, making car commuting straightforward to major business districts. The Main Road corridor ensures easy movement toward the city center.
Both neighborhoods offer rapid access to highways, the V&A Waterfront, and main business districts. Commute times to the CBD typically range from 10-15 minutes by car or MyCiTi bus.
It's something we develop in our South Africa property pack.
What lifestyle amenities does each area offer, and how do these influence property demand?
1. **Restaurants and Dining**: Sea Point offers more diverse dining options along Main Road and the promenade, while Green Point features upscale restaurants near the Waterfront 2. **Fitness and Recreation**: Both areas have multiple gyms, with Green Point offering access to stadium facilities and Sea Point providing beachfront running routes 3. **Schools and Education**: Sea Point provides proximity to several high-ranking schools, while Green Point offers easier access to city-center educational institutions 4. **Medical Facilities**: Both neighborhoods feature quality clinics and medical centers within walking distance 5. **Shopping and Services**: Green Point benefits from Waterfront proximity, while Sea Point offers concentrated retail along Main RoadThese amenities significantly drive property demand by creating complete lifestyle environments. Sea Point's promenade activities and diverse food scene attract families and young professionals, while Green Point's upscale amenities and Waterfront access appeal to luxury seekers.
The abundance of walking-distance amenities in both areas reduces car dependency and enhances quality of life, making properties more attractive to both residents and rental tenants.
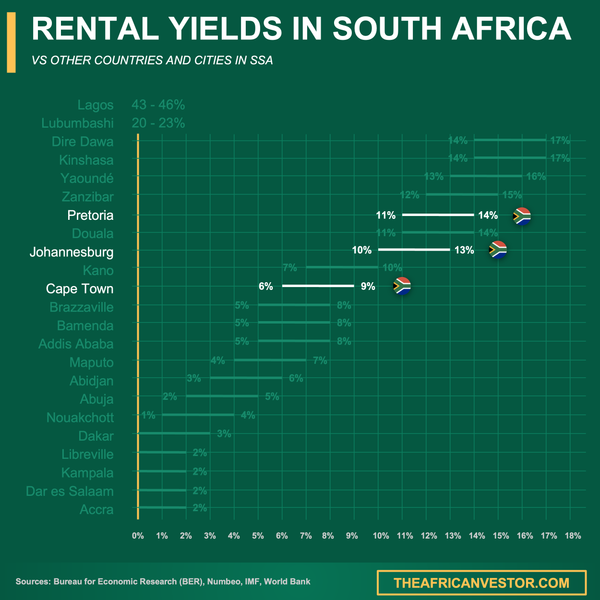
We did some research and made this infographic to help you quickly compare rental yields of the major cities in South Africa versus those in neighboring countries. It provides a clear view of how this country positions itself as a real estate investment destination, which might interest you if you're planning to invest there.
How does the proximity to ocean and promenade affect long-term property values differently in Sea Point compared to Green Point?
Sea Point's direct sea and promenade frontage creates a significant long-term value premium, particularly for properties with ocean views and beachfront access.
Properties directly facing the ocean or promenade in Sea Point command substantial premiums and show stronger value resilience during market downturns. The unobstructed ocean access cannot be replicated, creating scarcity value.
Green Point's ocean proximity provides benefits without the direct frontage premium. However, its broader access to parks, the stadium, and Waterfront creates different but valuable appeal for investors focused on short-term rentals and tourist markets.
The promenade in Sea Point drives consistent foot traffic and tourism, supporting both residential appeal and commercial property values. This creates a self-reinforcing cycle of amenity development and property appreciation.
Both areas benefit from high walkability and scenic appeal, but Sea Point's direct ocean connection provides more reliable long-term value protection against market volatility.
What do local regulations and zoning rules look like for short-term rentals in both areas, and how strictly are they being enforced right now?
Both Sea Point and Green Point allow short-term and Airbnb rentals, but enforcement of regulations has increased significantly across Cape Town in recent years.
Current enforcement focuses on noise restrictions, building access compliance, and proper zoning permits. City-wide restrictions now require stricter monitoring of guest behavior and building management cooperation.
Property owners must ensure compliance with municipal bylaws, body corporate rules, and rate-paying requirements to maintain rental permit status. Many buildings have implemented their own short-term rental policies.
Well-managed buildings with proper compliance systems continue to operate successfully, while properties lacking proper permits or management face increasing scrutiny from municipal authorities.
The regulatory environment favors professional operators who maintain good relationships with building management and ensure guest compliance with local rules.
What are experts and real estate agents predicting about the five-year investment outlook for Sea Point versus Green Point?
Real estate experts predict steady 4-5% annual price growth for both Sea Point and Green Point over the next five years, supported by continued semigration trends and international demand.
Cape Town's global appeal as a lifestyle destination continues driving demand from both domestic and international buyers. The weak rand maintains South Africa's property market attractiveness for foreign investors.
New supply in both areas may moderate yields at the top end of the market, but long-term fundamentals remain robust. Well-located apartments and professionally managed short-term rental units should maintain strong performance.
Both neighborhoods are considered premier Cape Town investment locations for their combination of capital growth potential and rental yield performance. The limited developable land ensures continued scarcity value.
It's something we develop in our South Africa property pack.
Conclusion
This article is for informational purposes only and should not be considered financial advice. Readers are advised to consult with a qualified professional before making any investment decisions. We do not assume any liability for actions taken based on the information provided.
Sea Point offers superior rental yields and direct ocean access, making it ideal for investors prioritizing income generation and long-term appreciation from beachfront proximity.
Green Point provides premium positioning and faster property sales, suited to investors seeking luxury market exposure and proximity to major commercial attractions.
Sources
- Sea Point Property Guide - Prices and Lifestyle Local Insights 2025
- Cape Town Property Market Trends
- Cape Town's Rental Market in 2025
- Best Neighborhoods Cape Town
- Sea Point Property Investment
- Green Point Property Prices Doubled in 5 Years
- Sea Point - An Investor's Eye View
- ES Cape Town Property Analysis
- Sea Point Property Review
- Sea Point and Green Point Apartments in High Demand