Authored by the expert who managed and guided the team behind the South Africa Property Pack

Get all the data you need about the real estate market in Durban
Durban in 2026 is not a simple yes or no property market, because good suburbs and weak suburbs are moving very differently.
We constantly update this blog post so the Durban property data stays close to the latest available market evidence.
The short version is that Durban still offers coastal value, but buyers must be strict on location, building quality, flood risk, levies and resale demand.
And if you’re planning to buy a property in this place, you may want to download our pack covering the real estate market in Durban.
So, is now a good time?
As of June 2026, Durban is a rather yes market for careful buyers, especially if the property is clean, financeable, well located and not exposed to flood or service issues.
The strongest signal is that Durban property prices in 2026 look fairly priced rather than overheated, because price growth is still close to inflation.
Another strong signal is that mortgage costs are still high in South Africa in 2026, so buyers still have room to negotiate in many Durban suburbs.
Other strong signals are Durban’s port economy, solid rental demand in the best suburbs, and the fact that good coastal stock remains limited.
The best strategy is to buy for the long term, focus on apartments, townhouses or family homes in liquid areas like Umhlanga, Durban North, Morningside, Glenwood, Westville, Hillcrest, Kloof and Amanzimtoti, and avoid weak buildings with high levies.
This is not financial or investment advice, because we do not know your personal situation and you should do your own research before buying property in Durban.

Is it smart to buy now in Durban, or should I wait as of 2026?
Do real estate prices look too high in Durban as of 2026?
As of 2026, Durban residential property prices look about fair value overall, with a rough citywide range from 5% below to 5% above what local rents, incomes, mortgage rates and recent price growth can justify.
The clearest listing signal is that Durban homes are still negotiable in 2026, because many ordinary listings need price cuts or offers below asking before a sale happens.
A second signal is that premium coastal areas like Umhlanga, Sibaya, La Lucia and Durban North are much tighter than older apartment blocks in Durban Central, South Beach, Berea and some inland suburbs, so the Durban market is not overpriced in one single way.
You can also read our latest update regarding the housing prices in Durban.
Does a property price drop look likely in Durban as of 2026?
As of 2026, the chance of a meaningful Durban property price decline over the next 12 months looks low to medium, not high.
A sensible 12 month range is about 0% to 3% nominal downside in weaker Durban suburbs and about 3% to 6% nominal upside in the better coastal, school belt and secure estate areas.
The one macro factor that could most increase the odds of a Durban property price drop is another affordability shock from high interest rates, because many buyers in KwaZulu Natal still depend on mortgage finance.
That risk is real but not our base case, because the South African Reserve Bank already had the policy rate at 7.00% in May 2026 and the next move depends heavily on inflation, the rand and global risk.
Finally, please note that we cover the price trends for next year in our pack about the property market in Durban.
Could property prices jump again in Durban as of 2026?
As of 2026, the chance of a renewed citywide Durban property price surge within the next 12 months looks medium in the best suburbs but low for the whole metro.
A realistic upside range is about 5% to 8% nominal growth in strong Durban areas if interest rates stop rising and buyer confidence improves.
The biggest demand trigger would be cheaper or easier credit, because lower monthly bond repayments would quickly help buyers in Durban North, Westville, Morningside, Glenwood, Hillcrest and Umhlanga compete harder for good homes.
Please also note that we regularly publish and update real estate price forecasts for Durban here.
Are we in a buyer or a seller market in Durban as of 2026?
As of 2026, Durban is a buyer leaning market overall, but it becomes seller leaning for clean, secure and fairly priced homes in the best suburbs.
The closest practical estimate is that Durban has roughly 5 to 8 months of usable inventory in many mainstream areas, which usually means buyers can negotiate but cannot demand deep discounts on the best stock.
We estimate that roughly one in four to one in three ordinary Durban listings need some form of price adjustment or realistic offer gap, which shows that sellers still have limited leverage outside prime pockets.
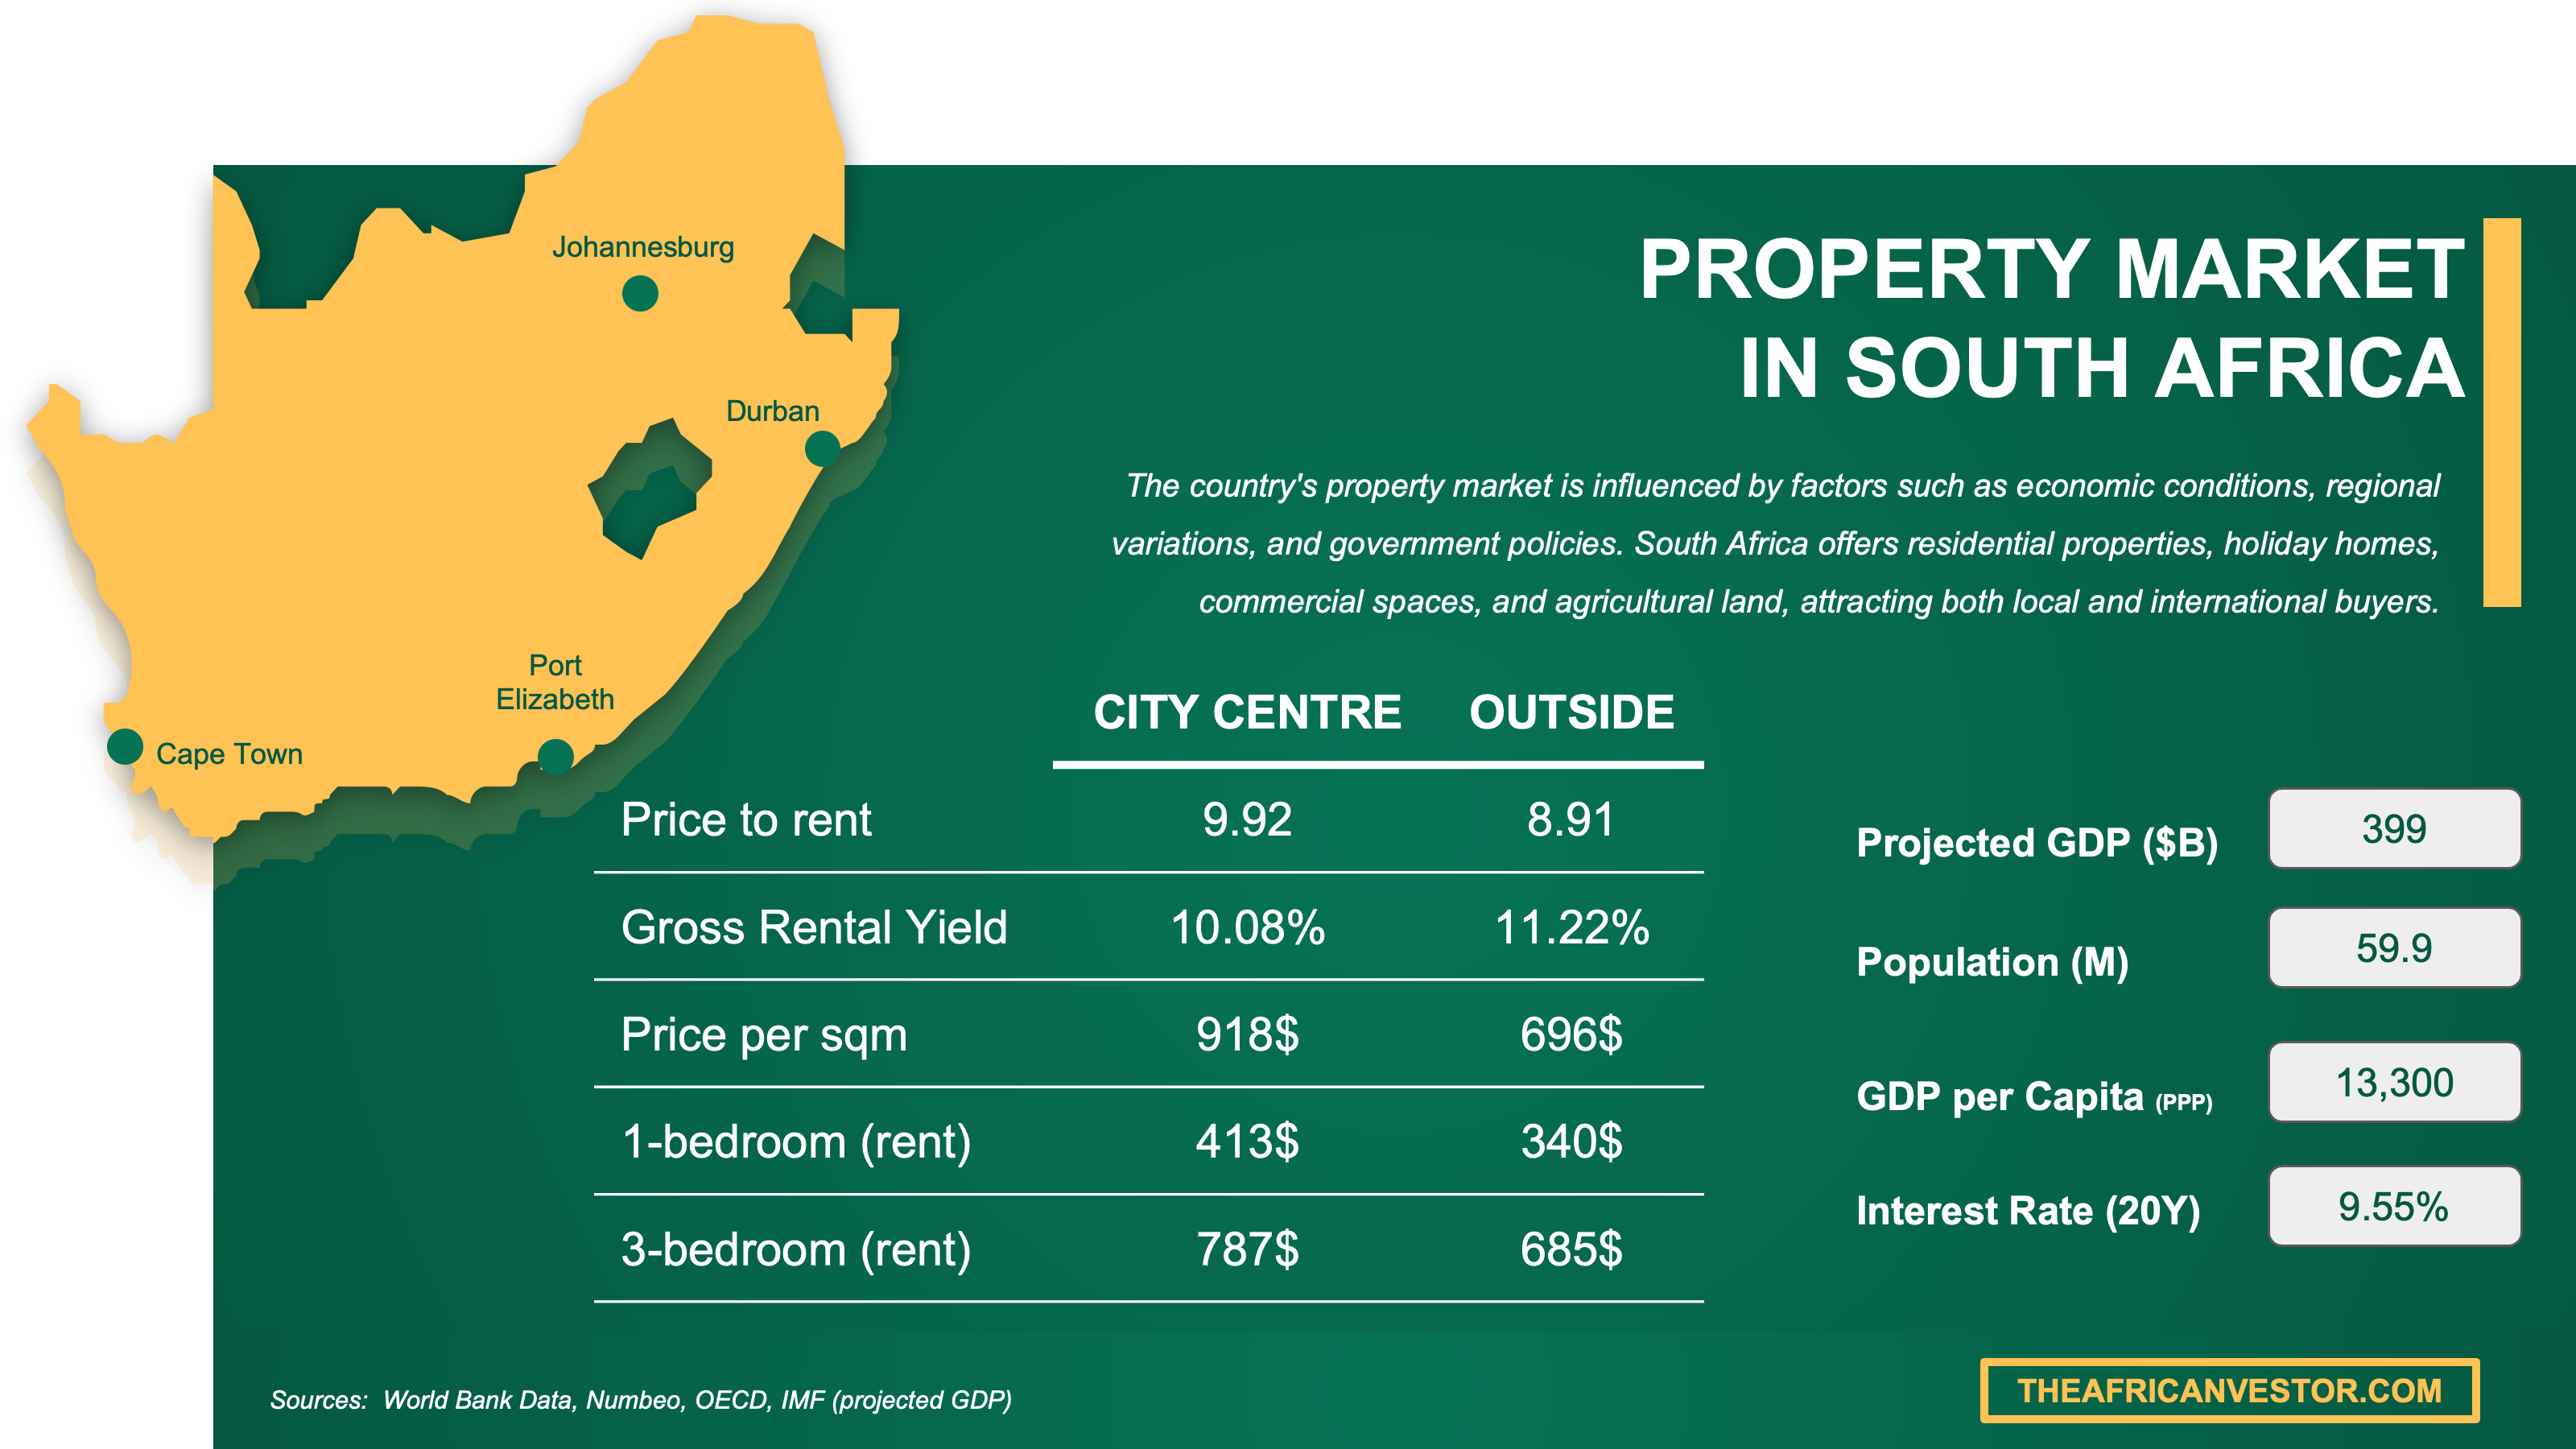
We have made this infographic to give you a quick and clear snapshot of the property market in South Africa. It highlights key facts like rental prices, yields, and property costs both in city centers and outside, so you can easily compare opportunities. We’ve done some research and also included useful insights about the country’s economy, like GDP, population, and interest rates, to help you understand the bigger picture.
Are homes overpriced, or fairly priced in Durban as of 2026?
Are homes overpriced versus rents or versus incomes in Durban as of 2026?
As of 2026, Durban homes look fair to mildly attractive versus rents, but they look stretched versus local incomes because salaries in eThekwini are not rising fast enough to make every R2 million to R3 million home feel affordable.
The estimated Durban price to rent ratio is roughly 13 to 17 for well bought apartments and townhouses, compared with a balanced market benchmark of about 15 to 18.
The estimated Durban price to income multiple is roughly 5 to 8 for many middle income buyers, compared with a more comfortable affordability zone of about 3 to 5.
Finally please note that you will have all the indicators you need in our property pack covering the real estate market in Durban.
Are home prices above the long-term average in Durban as of 2026?
As of 2026, Durban home prices are above their long term average in nominal rand terms, but not far above their inflation adjusted trend.
The estimated recent 12 month price change in Durban is around 3% to 5% in nominal terms, which is moderate and slower than a true boom market.
In real terms, Durban property prices in 2026 look below the strongest prior cycle peaks for many ordinary homes, while prime coastal homes in Umhlanga, La Lucia and Sibaya sit closer to the expensive end of their cycle.
Get fresh and reliable information about the market in Durban
Don't base significant investment decisions on outdated data. Get updated and accurate information.

What local changes could move prices in Durban as of 2026?
Are big infrastructure projects coming to Durban as of 2026?
As of 2026, the single biggest infrastructure project for Durban property confidence is the Durban Container Terminal Pier 2 upgrade and private partnership, which could support residential demand indirectly through jobs, logistics activity and business confidence.
The project is already in the partnership and implementation phase in 2026, but the full housing impact is more likely to arrive slowly through better port performance than through a sudden jump in Durban house prices.
For the latest updates on the local projects, you can read our property market analysis about Durban here.
Are zoning or building rules changing in Durban as of 2026?
The most important planning change in Durban is not one sudden new rule, but the continued push for densification corridors, mixed use nodes and transport linked growth in the 2025 and 2026 spatial framework.
As of 2026, the likely price effect is mixed, because better planning can lift amenity value but more apartment and townhouse supply can limit price growth for new units in the same corridor.
The most affected Durban areas are the Inner City, Umhlanga, uMhlanga Ridge, Pinetown, Bridge City, Cato Ridge, Umlazi, Amanzimtoti and the Hillcrest, Gillitts and Kloof corridor.
Are foreign-buyer or mortgage rules changing in Durban as of 2026?
As of 2026, there is no clear Durban specific foreign buyer rule change that should move prices, while mortgage affordability remains the more important rule of the game for most buyers.
The most likely foreign buyer change is not a ban or quota, but tighter compliance, documentation and bank checks for foreign income, which would affect individual buyers more than the whole Durban market.
The most likely mortgage change is not a new local rule, but lenders staying conservative on loan to value, income checks and affordability tests while prime lending rates remain high.
You can also read our latest update about mortgage and interest rates in South Africa.
Buying real estate in Durban can be risky
An increasing number of foreign investors are showing interest. However, 90% of them will make mistakes. Avoid the pitfalls with our comprehensive guide.

Will it be easy to find tenants in Durban as of 2026?
Is the renter pool growing faster than new supply in Durban as of 2026?
As of 2026, the renter pool in the best Durban areas is probably growing faster than good quality rental supply, but the wider city still has enough weak or average stock to keep landlords honest.
The best renter demand signal is the continued pull of jobs, hospitals, offices, beaches and schools around Umhlanga, uMhlanga Ridge, Durban North, Morningside, Glenwood, Musgrave, Westville, Hillcrest and Kloof.
The best supply signal is that national residential building plans improved in early 2026, but Durban still faces real delivery limits from infrastructure, serviced land, finance costs and flood resilience.
Are days-on-market for rentals falling in Durban as of 2026?
As of 2026, well priced Durban rentals usually take about 14 to 35 days to let in strong suburbs, and this looks slightly faster than weaker parts of the city.
The gap is important because a clean townhouse in Umhlanga or Westville can let in a few weeks, while an overpriced flat in a weak building can sit for two months or more.
The common reason time to let falls in Durban is not just rent growth, but the shortage of secure, well managed homes with parking, backup utilities and good commute access.
Are vacancies dropping in the best areas of Durban as of 2026?
As of 2026, vacancies are likely dropping in Umhlanga, uMhlanga Ridge, Durban North, Morningside, Glenwood, Musgrave, Westville, Hillcrest, Kloof and Amanzimtoti, but not across every Durban rental area.
A sensible estimate is 4% to 7% vacancy in the best Durban rental nodes versus a higher risk level in weaker or overpriced buildings.
One practical sign of tightening is that landlords with clean units, fair rents and reliable building management can reject weaker applicants instead of accepting the first tenant who enquires.
By the way, we’ve written a blog article detailing what are the current rent levels in Durban.
Make a profitable investment in Durban
Better information leads to better decisions. Save time and money. Download our data.
Am I buying into a tightening market in Durban as of 2026?
Is for-sale inventory shrinking in Durban as of 2026?
As of 2026, it is hard to prove that Durban for sale inventory is shrinking citywide, but usable inventory is clearly tighter than the headline listing count suggests.
The closest supply estimate is about 5 to 8 months of practical stock in many Durban segments, compared with around 5 to 6 months for a balanced market.
The most likely reason usable inventory feels tighter is that many listings are either overpriced, in weaker buildings, exposed to higher levies, or located in areas with service and flood concerns.
Are homes selling faster in Durban as of 2026?
As of 2026, well priced Durban homes are selling in about 60 to 90 days in mainstream suburbs, while standout stock can move faster.
The estimated year over year change is only a mild improvement for good Durban stock, because high mortgage rates still slow many buyers and overpriced homes can still sit for 120 days or more.
Are new listings slowing down in Durban as of 2026?
As of 2026, we are not confident enough to give a precise year over year new listing change for Durban, but new quality listings appear slower in the better suburbs than in the broad market.
The normal Durban pattern is that listings often improve when households relocate, downscale or trade before the warmer coastal season, but the current level of clean stock does not look unusually generous.
The most plausible reason is seller caution, because owners of good homes in Durban North, Westville, Morningside, Glenwood, Hillcrest and Umhlanga often struggle to find an affordable next home.
Is new construction failing to keep up in Durban as of 2026?
As of 2026, new construction is probably failing to keep up with demand for serviced, secure and well located Durban homes, but it may still add enough generic units in some corridors.
Stats SA building data for early 2026 shows residential building plans improved nationally, yet plans are not the same as completed homes in the best Durban areas.
The biggest bottleneck in Durban is infrastructure readiness, because serviced land, water, sanitation, roads, flood resilience and municipal capacity decide whether approved housing becomes livable supply.
Get to know the market before buying a property in Durban
Better information leads to better decisions. Get all the data you need before investing a large amount of money.
Will it be easy to sell later in Durban as of 2026?
Is resale liquidity strong enough in Durban as of 2026?
As of 2026, resale liquidity in Durban is strong enough for mainstream homes that are priced realistically, but weak for niche, luxury, flawed or high levy properties.
The estimated median resale time is about 60 to 90 days for normal good stock, which is close to a healthy liquidity benchmark in a high interest rate market.
The single characteristic that most improves resale liquidity in Durban is practical livability, meaning security, parking, good building management, no flood issue and easy access to schools, jobs or beaches.
Is selling time getting longer in Durban as of 2026?
As of 2026, selling time in Durban is not clearly getting longer for good stock, but it is longer for homes priced above realistic market value.
The current practical range is about 30 to 60 days for standout homes, 60 to 90 days for well priced mainstream homes, and 120 days or more for overpriced or flawed listings.
The main reason selling time can lengthen in Durban is affordability pressure, because a 10.50% prime lending rate forces buyers to be very selective on price, levies and monthly ownership costs.
Is it realistic to exit with profit in Durban as of 2026?
As of 2026, the likelihood of exiting with a profit in Durban is medium if the buyer holds for at least five years and buys below or close to fair value.
The minimum realistic holding period is usually five years, because short holds can be wiped out by transfer duty, bond costs, maintenance, rates and selling commission.
A typical round trip cost drag can easily reach about R160,000 to R300,000 on a R2 million Durban property, which is roughly $9,000 to $17,000 or €8,000 to €15,500 depending on exchange rates.
The factor that most increases profit odds is buying a liquid property below market value in a proven Durban demand node like Umhlanga, Durban North, Morningside, Glenwood, Westville, Hillcrest, Kloof or Amanzimtoti.

We made this infographic to show you how property prices in South Africa compare to other big cities across the region. It breaks down the average price per square meter in city centers, so you can see how cities stack up. It’s an easy way to spot where you might get the best value for your money. We hope you like it.
What sources have we used to write this blog article?
Whether it’s in our blog articles or the market analyses included in our property pack about Durban, we always rely on the strongest methodology we can, and we don’t throw out numbers at random.
We also aim to be fully transparent, so below we’ve listed the authoritative sources we used, and explained how we used them and the methods behind our estimates.
| Source | Why we trust it | How we used it |
|---|---|---|
| Stats SA Residential Property Price Index | Stats SA is the official statistics agency for South Africa. | We used it to anchor Durban against national and provincial house price inflation. We treated it as the best official price cycle source. |
| Lightstone House Price Index | Lightstone uses deeds based residential transaction data. | We used it to cross check official price data with transaction based market signals. We also used it to judge momentum in KwaZulu Natal. |
| Property24 Durban property trends | Property24 is a major South African property portal. | We used it to read current asking market behaviour in Durban. We did not treat asking prices as final sale prices. |
| Property24 Durban property values | It gives useful local price and valuation signals. | We used it to anchor current Durban price levels and listing depth. We adjusted the numbers for suburb mix and luxury stock. |
| SARB MPC announcements | SARB is the official monetary policy source. | We used it to assess mortgage affordability in South Africa in 2026. We treated rates as a key brake on Durban buyer demand. |
| SARB May 2026 MPC statement | It explains the rate decision and inflation risks. | We used it to judge whether cheaper mortgage conditions were likely soon. We linked this to Durban buyer bargaining power. |
| Stats SA CPI | Stats SA is the official inflation source. | We used it to compare property price growth with consumer inflation. We focused on real price pressure, not only nominal prices. |
| Stats SA selected building statistics | It tracks official building plans and completions. | We used it to assess whether new housing supply is improving. We separated approved plans from finished homes. |
| eThekwini Integrated Development Plan | It is the municipality’s official planning framework. | We used it to identify service delivery and infrastructure priorities. We treated these as local property risk and demand factors. |
| eThekwini 2025 and 2026 Spatial Development Framework | It guides land use and growth direction in Durban. | We used it to identify densification corridors and future supply zones. We treated it as planning intent, not guaranteed construction. |
| eThekwini densification corridors map | It shows official areas targeted for more density. | We used it to understand where apartments and townhouses may increase. We flagged these areas for future competition risk. |
| eThekwini GV 2026 valuation roll | It is the official municipal valuation platform. | We used it to flag ownership cost risk in 2026. We treated rates and valuations as important holding cost factors. |
| TPN Residential Rental Monitor | TPN tracks tenant payment quality and rental risk. | We used it to assess KwaZulu Natal tenant payment risk. We treated tenant quality as a key Durban landlord risk. |
| PayProp Rental Index | PayProp processes large rental payment volumes. | We used it to cross check rental growth and affordability pressure. We relied on it mainly for provincial rental momentum. |
| Durban Edge economic data hub | It is eThekwini’s official economic data portal. | We used it to assess Durban’s GDP, unemployment and property value base. We linked local economics to housing demand. |
| Transnet Durban Terminals | Transnet is the official port and rail operator. | We used it to understand Durban port capacity and upgrades. We treated port reform as a medium term demand support. |
Don't buy the wrong property, in the wrong area of Durban
Buying real estate is a significant investment. Don't rely solely on your intuition. Gather the right information to make the best decision.
Related blog posts
- What are the best areas to buy a property in property in Durban?