Authored by the expert who managed and guided the team behind the South Africa Property Pack

Get all the data you need about the real estate market in Johannesburg
We constantly update this blog post so buyers can read it with fresh Johannesburg property market data.
As of June 2026, Johannesburg looks like a market where careful buyers can still find fair prices, especially when sellers are realistic.
The main point is simple: Johannesburg residential property is not cheap everywhere, but the city does not look broadly overheated either.
And if you’re planning to buy a property in this place, you may want to download our pack covering the real estate market in Johannesburg.
So, is now a good time?
Rather yes, as of June 2026, buying a property in Johannesburg can make sense if you choose a liquid area, avoid weak buildings, and negotiate the price.
The strongest signal is that Johannesburg property prices in 2026 still look modest compared with stronger South African markets such as Cape Town.
Another strong signal is that the prime lending rate of about 10.50% keeps many buyers cautious, which gives serious buyers more room to negotiate.
Other useful signals are improving first-time-buyer demand in Gauteng, firmer rentals in good nodes, and weak new construction in the right parts of Johannesburg.
The best strategy is to focus on secure apartments, townhouses and family homes in Sandton, Rosebank, Bryanston, Randburg, Fourways, Midrand, Melville, Parktown and selected Soweto areas, with a long-term hold rather than a quick flip.
This is not financial or investment advice, we do not know your personal situation, and you should do your own research before buying property in Johannesburg.

Is it smart to buy now in Johannesburg, or should I wait as of 2026?
Do real estate prices look too high in Johannesburg as of 2026?
As of 2026, Johannesburg homes look broadly fairly valued to about 5% overpriced, with the best value in secure apartments, townhouses and family homes below roughly R2.5 million.
This fits what buyers are seeing on the ground, because many Johannesburg sellers still accept discounts when a listing is old, the levy is high, or the home needs repairs.
The second signal is that Gauteng has not had the same price heat as the Western Cape, so Johannesburg property prices in 2026 still leave more room for negotiation than Cape Town property prices.
You can also read our latest update regarding the housing prices in Johannesburg.
Does a property price drop look likely in Johannesburg as of 2026?
As of 2026, the risk of a meaningful Johannesburg property price decline over the next 12 months looks low to medium rather than high.
A realistic range is roughly 3% down to 6% up for average Johannesburg homes, with better results possible for renovated homes in Sandton, Rosebank, Bryanston, Randburg, Fourways and Midrand.
The one macro factor that could most increase the risk of a Johannesburg price drop is weaker employment, because job stress directly hurts bond approvals and tenant affordability.
That risk is real, but a large new shock looks less likely than a slow market where overpriced homes simply sit for longer.
Finally, please note that we cover the price trends for next year in our pack about the property market in Johannesburg.
Could property prices jump again in Johannesburg as of 2026?
As of 2026, the chance of a broad Johannesburg property price surge within the next 12 months looks low, but the chance of selective jumps in good suburbs looks medium.
The upside range we would consider plausible is about 5% to 10% for strong Johannesburg stock, especially secure homes near jobs, schools and transport.
The biggest demand-side trigger would be faster interest-rate relief, because lower monthly bond payments would pull more first-time buyers into the Johannesburg housing market.
Please also note that we regularly publish and update real estate price forecasts for Johannesburg here.
Are we in a buyer or a seller market in Johannesburg as of 2026?
As of 2026, Johannesburg is still a buyer-leaning market overall, although the best renovated homes in Sandton, Rosebank, Bryanston, Parkhurst and Midrand behave more like a balanced market.
The closest simple estimate is about 4 to 6 months of usable supply in stronger Johannesburg areas, which usually means buyers still have bargaining power but cannot be careless.
We estimate that roughly 20% to 30% of weaker or overpriced Johannesburg listings need a price reduction or serious negotiation, which tells us sellers do not control the whole market.
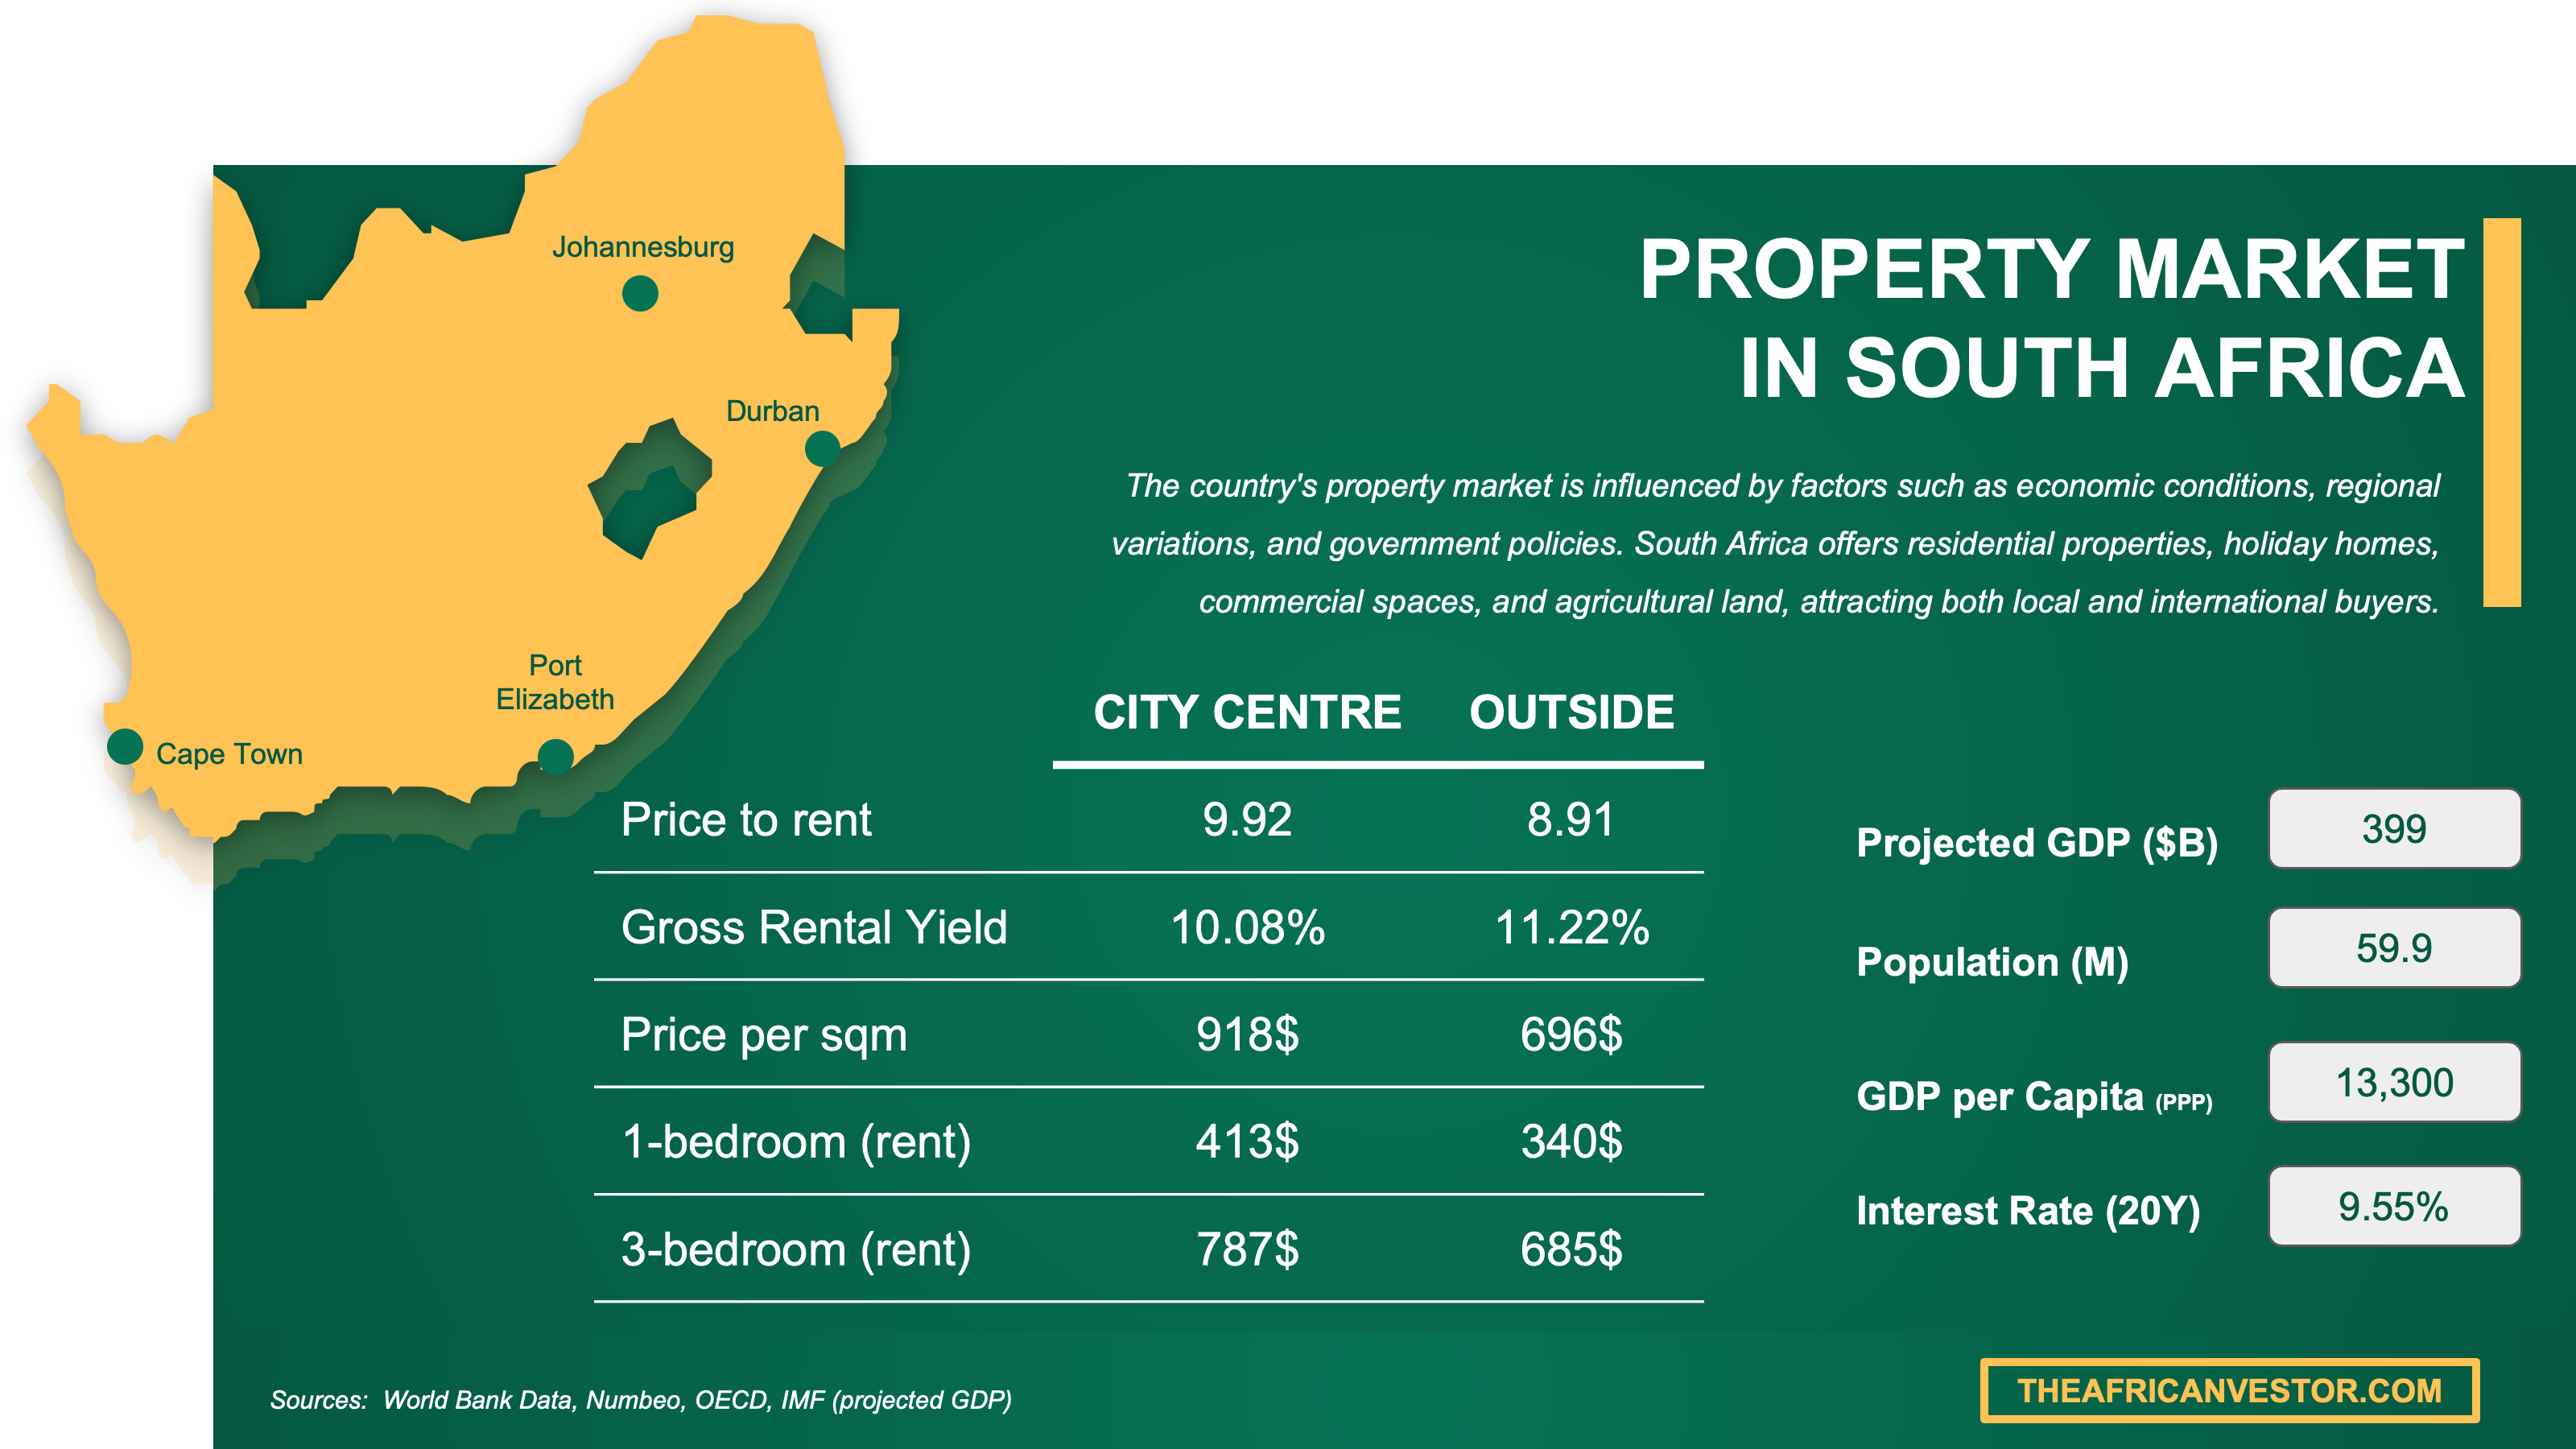
We have made this infographic to give you a quick and clear snapshot of the property market in South Africa. It highlights key facts like rental prices, yields, and property costs both in city centers and outside, so you can easily compare opportunities. We’ve done some research and also included useful insights about the country’s economy, like GDP, population, and interest rates, to help you understand the bigger picture.
Are homes overpriced, or fairly priced in Johannesburg as of 2026?
Are homes overpriced versus rents or versus incomes in Johannesburg as of 2026?
As of 2026, Johannesburg homes look fairly priced versus rents, but more stretched versus incomes because mortgage payments are still heavy for many households.
The estimated Johannesburg price-to-rent ratio is around 12 to 16 for many apartments and townhouses, which is close to a balanced market rather than a bubble market.
The estimated Johannesburg price-to-income multiple is harder for middle-income buyers, often around 4 to 6 times household income in better suburbs, while a more comfortable level is closer to 3 to 4 times.
Finally please note that you will have all the indicators you need in our property pack covering the real estate market in Johannesburg.
Are home prices above the long-term average in Johannesburg as of 2026?
As of 2026, Johannesburg home prices are above old nominal levels, but they do not look far above the long-term trend after inflation.
The estimated 12-month Johannesburg price change is modest, around low single digits in many segments, which is slower than a classic boom phase.
In inflation-adjusted terms, Johannesburg property prices in 2026 look close to flat versus the previous cycle peak, so the market feels expensive monthly but not inflated in real value terms.
Get fresh and reliable information about the market in Johannesburg
Don't base significant investment decisions on outdated data. Get updated and accurate information.

What local changes could move prices in Johannesburg as of 2026?
Are big infrastructure projects coming to Johannesburg as of 2026?
As of 2026, the biggest planned infrastructure project for Johannesburg property values is the Gauteng Rapid Rail Integrated Network expansion, especially routes that could improve access toward Soweto, Randburg, Cosmo City and other Gauteng nodes.
The likely timeline is long, because route planning and approvals are moving before full delivery, so buyers should treat the Gautrain expansion as future upside rather than a reason to overpay in 2026.
For the latest updates on the local projects, you can read our property market analysis about Johannesburg here.
Are zoning or building rules changing in Johannesburg as of 2026?
The most important planning direction in Johannesburg is not one sudden rule change, but the city’s push toward denser, mixed-use, transit-linked development in the right nodes.
As of 2026, this should support apartments and townhouses more than large low-density houses, but the effect will be gradual because infrastructure and municipal capacity still matter.
The areas most affected are the inner city, Rosebank, Sandton, Randburg links, the Louis Botha corridor, the Empire-Perth corridor, Midrand and parts of Soweto where better transport and density can work together.
Are foreign-buyer or mortgage rules changing in Johannesburg as of 2026?
As of 2026, there is no major Johannesburg-specific foreign-buyer rule change driving prices, so mortgage affordability matters much more than foreign-buyer regulation.
The most likely foreign-buyer issue is not a ban, but normal administration around transfer, tax, legal checks and exchange-control paperwork for non-resident buyers.
The most likely mortgage change is softer affordability if interest rates fall further, although banks are still likely to check income, deposit strength and credit risk carefully.
You can also read our latest update about mortgage and interest rates in South Africa.
Buying real estate in Johannesburg can be risky
An increasing number of foreign investors are showing interest. However, 90% of them will make mistakes. Avoid the pitfalls with our comprehensive guide.

Will it be easy to find tenants in Johannesburg as of 2026?
Is the renter pool growing faster than new supply in Johannesburg as of 2026?
As of 2026, the renter pool in good Johannesburg nodes appears to be growing faster than new rental supply, especially for secure one-bedroom and two-bedroom units.
The best renter-demand signal is continued household growth in Gauteng and steady movement toward job nodes such as Sandton, Rosebank, Midrand, Braamfontein, Parktown and Bedfordview.
The supply signal is weaker residential building activity, which means formal new stock is not arriving evenly in the places where many Johannesburg tenants want to live.
Are days-on-market for rentals falling in Johannesburg as of 2026?
As of 2026, well-priced Johannesburg rentals in good areas often lease in about 2 to 5 weeks, and this looks slightly faster than the weaker period of 2023 and 2024.
The gap is wide, because a clean unit in Sandton, Rosebank, Bryanston, Midrand or Fourways may move quickly, while a weak building or overpriced flat can sit for 6 to 10 weeks.
The main reason rental days-on-market falls in Johannesburg is that tenants pay faster for secure buildings with backup power, good access and predictable monthly costs.
Are vacancies dropping in the best areas of Johannesburg as of 2026?
As of 2026, vacancies appear to be dropping moderately in better Johannesburg rental areas such as Sandton, Rosebank, Bryanston, Midrand, Fourways, Randburg, Melville, Parktown and Bedfordview.
We estimate practical vacancy around 4% to 7% in strong nodes, compared with above 10% in some weaker or poorly managed sectional-title buildings.
A practical sign of tightening in Johannesburg is that tenants increasingly compare backup power, water reliability, security and body-corporate quality before they compare only rent.
By the way, we’ve written a blog article detailing what are the current rent levels in Johannesburg.
Make a profitable investment in Johannesburg
Better information leads to better decisions. Save time and money. Download our data.
Am I buying into a tightening market in Johannesburg as of 2026?
Is for-sale inventory shrinking in Johannesburg as of 2026?
As of 2026, we estimate Johannesburg for-sale inventory is shrinking slightly in the best segments, but we are less confident about the exact citywide figure because public listing stock data is fragmented.
The closest practical estimate is about 4 to 6 months of supply in stronger Johannesburg suburbs, compared with roughly 6 months as a simple balanced-market guide.
The most likely reason inventory is shrinking in good Johannesburg segments is that realistic sellers can transact, while owners of good homes are less forced to sell after interest-rate pressure eased from the peak.
Are homes selling faster in Johannesburg as of 2026?
As of 2026, a realistic median time-to-sell for Johannesburg homes is about 8 to 12 weeks for well-priced stock, and this is slightly faster than the slowest recent period.
Compared with last year, we estimate good Johannesburg homes may be selling about 1 to 3 weeks faster, while overpriced homes still take several months.
Are new listings slowing down in Johannesburg as of 2026?
As of 2026, we estimate new for-sale listings in stronger Johannesburg areas are down slightly year on year, probably around 5% to 10%, but we are not fully confident in a single citywide number.
Johannesburg usually sees more listing activity around normal moving seasons, so the current level does not look frozen, but it does look more selective than a stressed seller market.
The most plausible reason is seller caution, because many owners will list only if they can get a fair price or move to a better property without taking on too much debt.
Is new construction failing to keep up in Johannesburg as of 2026?
As of 2026, new construction appears to be failing to keep up with demand for affordable formal housing and well-located middle-market homes in Johannesburg.
The recent permits and building-plan trend is not a boom, because official building statistics show residential activity remains constrained by finance, costs and municipal capacity.
The biggest bottleneck is infrastructure reliability, because developers and buyers both worry about power, water, roads, approvals and monthly municipal costs.
Get to know the market before buying a property in Johannesburg
Better information leads to better decisions. Get all the data you need before investing a large amount of money.
Will it be easy to sell later in Johannesburg as of 2026?
Is resale liquidity strong enough in Johannesburg as of 2026?
As of 2026, resale liquidity in Johannesburg is strong enough for mainstream homes when the property is secure, well located, correctly priced and easy to finance.
The estimated median resale time is around 8 to 12 weeks for good stock, which is close to a healthy liquidity benchmark of roughly 2 to 3 months.
The property feature that most improves resale liquidity in Johannesburg is practical resilience, meaning good security, backup power or water, low maintenance needs and access to jobs.
Is selling time getting longer in Johannesburg as of 2026?
As of 2026, selling time in Johannesburg is not generally getting longer for realistic sellers, but it remains long for overpriced homes and weak buildings.
The current median is roughly 8 to 12 weeks for good stock, with a realistic range from 4 weeks for excellent listings to more than 20 weeks for overpriced or poorly located properties.
Selling time can lengthen in Johannesburg when affordability pressure rises, because buyers become strict about bond repayments, levies, repairs and municipal costs.
Is it realistic to exit with profit in Johannesburg as of 2026?
As of 2026, the likelihood of selling with a profit in Johannesburg is medium for a normal long-term hold, but low for buyers who overpay and sell too quickly.
The minimum holding period that usually makes profit realistic in Johannesburg is about 5 to 7 years, because buying costs, selling costs and maintenance need time to be absorbed.
The estimated round-trip cost drag is often around 10% to 15% of the property value, so on a R2 million home that is roughly R200,000 to R300,000, about $12,400 to $18,600, or about €10,700 to €16,000 using June 2026 SARB exchange rates.
The factor that most increases profit odds is buying at least 5% to 10% below fair value in a liquid Johannesburg suburb where future buyers and tenants are easy to find.

We made this infographic to show you how property prices in South Africa compare to other big cities across the region. It breaks down the average price per square meter in city centers, so you can see how cities stack up. It’s an easy way to spot where you might get the best value for your money. We hope you like it.
What sources have we used to write this blog article?
Whether it’s in our blog articles or the market analyses included in our property pack about Johannesburg, we always rely on the strongest methodology we can, and we do not throw out numbers at random.
We also aim to be fully transparent, so below we’ve listed the authoritative sources we used, and explained how we used them and the methods behind our estimates.
| Source | Why this source matters | How we used it |
|---|---|---|
| South African Reserve Bank current market rates | SARB is South Africa’s central bank and the best source for current rates. | We used the prime lending rate to judge mortgage affordability. We also used SARB exchange rates for rand, dollar and euro estimates. |
| FNB Housing Market Outlook 2026 | FNB is a major mortgage lender with a long housing-market research record. | We used FNB to assess market balance and buyer confidence. We compared its view with Lightstone, ooba and SARB. |
| Lightstone Property Newsletter March 2026 | Lightstone is a major South African property data and valuation provider. | We used Lightstone to read national and provincial price momentum. We paid attention to Gauteng’s weaker growth versus the Western Cape. |
| Lightstone Property Newsletter January 2026 | Lightstone gives repeatable price-index commentary from deeds and market data. | We used it to check whether prices looked overheated. We compared it with FNB and mortgage-application data. |
| Stats SA selected building statistics P5041.1 | Stats SA is South Africa’s official statistics agency. | We used building-plan data to assess new residential supply. We treated weak construction as support for good existing stock. |
| Stats SA Census 2022 statistical release | Census data is the official base for population and household demand. | We used it to understand long-term housing demand in Gauteng. We compared it with City of Johannesburg planning documents. |
| Stats SA Quarterly Labour Force Survey Q1 2026 | Official jobs data is essential for buyer and tenant affordability. | We used labour-market stress to temper the bullish case. We treated unemployment as a cap on broad price jumps. |
| City of Johannesburg 2025/26 IDP People’s Version | The IDP shows the city’s own priorities and infrastructure constraints. | We used it to identify local service-delivery risks. We connected those risks to prices, rents and resale liquidity. |
| City of Johannesburg Spatial Development Framework 2040 | The SDF is Johannesburg’s official spatial plan for growth and density. | We used it to identify nodes and corridors with long-term support. We focused on Sandton, Rosebank, Randburg, Midrand, Soweto and the inner city. |
| City of Johannesburg Property Rates Policy 2025/26 | It governs municipal property rates, which affect owner costs. | We used it to assess holding-cost risk. We treated municipal costs as a Johannesburg-specific drag on net returns. |
| Gautrain Management Agency GRRIN project | It is the official platform for proposed Gauteng rapid-rail extensions. | We used it to assess future transport-led uplift. We did not assume immediate 2026 price gains. |
| Gautrain draft route determination report | It gives technical detail on proposed rapid-rail routes. | We used it to identify possible future connectivity benefits. We treated station-area upside as long term. |
| Rode Report Q1 2026 | Rode is a long-established South African property research firm. | We used it for rentals, vacancies and property-cycle signals. We cross-checked it with TPN and PayProp. |
| MRI TPN property market trends 2026 | TPN tracks tenant behaviour and rental-market conditions. | We used it to read rental pressure and tenant quality. We compared it with PayProp rental-payment data. |
| PayProp Rental Index | PayProp uses processed rental payments, not only asking rents. | We used it to estimate rental growth and tenant demand. We cross-checked it against TPN and Rode. |
| ooba South Africa Property Market Trends 2026 | ooba is a major bond originator with useful application data. | We used ooba to read credit appetite and buyer demand. We compared it with FNB, SARB and Pam Golding. |
| Pam Golding Johannesburg and Gauteng buyer data | Pam Golding is a major national estate agency using ooba data. | We used it for first-time-buyer demand in Johannesburg. We treated it as market evidence, not an official price index. |
Don't buy the wrong property, in the wrong area of Johannesburg
Buying real estate is a significant investment. Don't rely solely on your intuition. Gather the right information to make the best decision.
Related blog posts
- What are the best areas to buy a property in property in Johannesburg?