Authored by the expert who managed and guided the team behind the South Africa Property Pack

Get all the data you need about the real estate market in South Africa
We constantly update this blog post to reflect the latest South Africa property market data, mortgage rates, rents and local housing signals.
In June 2026, South Africa is not a simple “cheap” or “expensive” market, because Cape Town, Gauteng, KwaZulu-Natal and smaller towns are moving at different speeds.
The main question is whether buying residential property in South Africa now gives you enough value, rental demand and resale safety to justify acting before prices move further.
And if you’re planning to buy a property in this place, you may want to download our pack covering the real estate market in South Africa.
So, is now a good time?
As of June 2026, it is rather yes a good time to buy property in South Africa, but only if you buy in a strong location and avoid overpaying.
The strongest signal is that South Africa house prices are rising again, with official national residential price growth at 7.8% in January 2026.
Another strong signal is that mortgage demand has recovered, which means buyers are coming back even with the South African prime rate still at 10.50%.
Other strong signals are firm rents, uneven new supply, and strong demand in Cape Town, Stellenbosch, Somerset West, Sandton, Rosebank, Waterfall, Pretoria East, Umhlanga and Ballito.
The best strategy is to buy a mainstream apartment, townhouse, family house or estate home in a deep rental and resale market, then hold it for at least five years rather than trying to flip quickly.
This is not financial or investment advice, we do not know your personal situation, and you should do your own research before buying property in South Africa.

Is it smart to buy now in South Africa, or should I wait as of 2026?
Do real estate prices look too high in South Africa as of 2026?
As of 2026, South Africa residential property prices look about 0% to 8% above fair value nationally, while prime Cape Town and Western Cape homes look closer to 10% to 20% expensive compared with local incomes and rents.
The clearest on-the-ground signal is that well-located South Africa listings in Cape Town, Stellenbosch, Somerset West, Umhlanga, Ballito, Sandton and Rosebank are attracting stronger buyer interest, while weaker suburbs still need price cuts to move.
That split matters because South Africa is not one housing market in 2026, and a seller in the Atlantic Seaboard has much more leverage than a seller of an overpriced home in a weaker-service area.
You can also read our latest update regarding the housing prices in South Africa.
Does a property price drop look likely in South Africa as of 2026?
As of 2026, a meaningful property price decline in South Africa looks low to medium risk nationally, but the risk is higher for luxury homes, weak municipalities and overpriced listings.
Over the next 12 months, a plausible national range is about 2% down to 7% up in nominal terms, with stronger Western Cape nodes still able to outperform that range.
The most important macro factor that could increase the odds of a South Africa property price drop is another shock to mortgage affordability, because a 10.50% prime rate already makes monthly repayments heavy for many buyers.
This factor is possible but not our base case, because inflation is not exploding, GDP is still growing slowly, and the main weakness is household income pressure rather than a sudden credit freeze.
Finally, please note that we cover the price trends for next year in our pack about the property market in South Africa.
Could property prices jump again in South Africa as of 2026?
As of 2026, the likelihood of a renewed South Africa property price surge is medium in the best areas and low to medium nationally.
Over the next 12 months, a realistic upside range is about 4% to 7% nationally, with 7% to 11% possible in the strongest Cape Town, Stellenbosch, Somerset West, Umhlanga, Ballito and Gauteng growth nodes.
The biggest demand-side trigger would be easier mortgage affordability, because even a small improvement in bond repayments can bring many South Africa buyers back into the market.
Please also note that we regularly publish and update real estate price forecasts for South Africa here.
Are we in a buyer or a seller market in South Africa as of 2026?
As of 2026, South Africa is a balanced-to-seller-leaning property market nationally, with Cape Town and the Western Cape clearly more seller-friendly than many parts of Gauteng and KwaZulu-Natal.
South Africa does not have one clean official months-of-inventory series, but our closest reading is roughly 4 to 6 months in strong nodes and 6 to 9 months in slower areas, which means buyers still have bargaining power outside the hottest suburbs.
The estimated share of listings needing price reductions is likely low in prime Cape Town and higher in softer Johannesburg, Pretoria and secondary areas, which suggests sellers have leverage only when the home is well-priced and well-located.
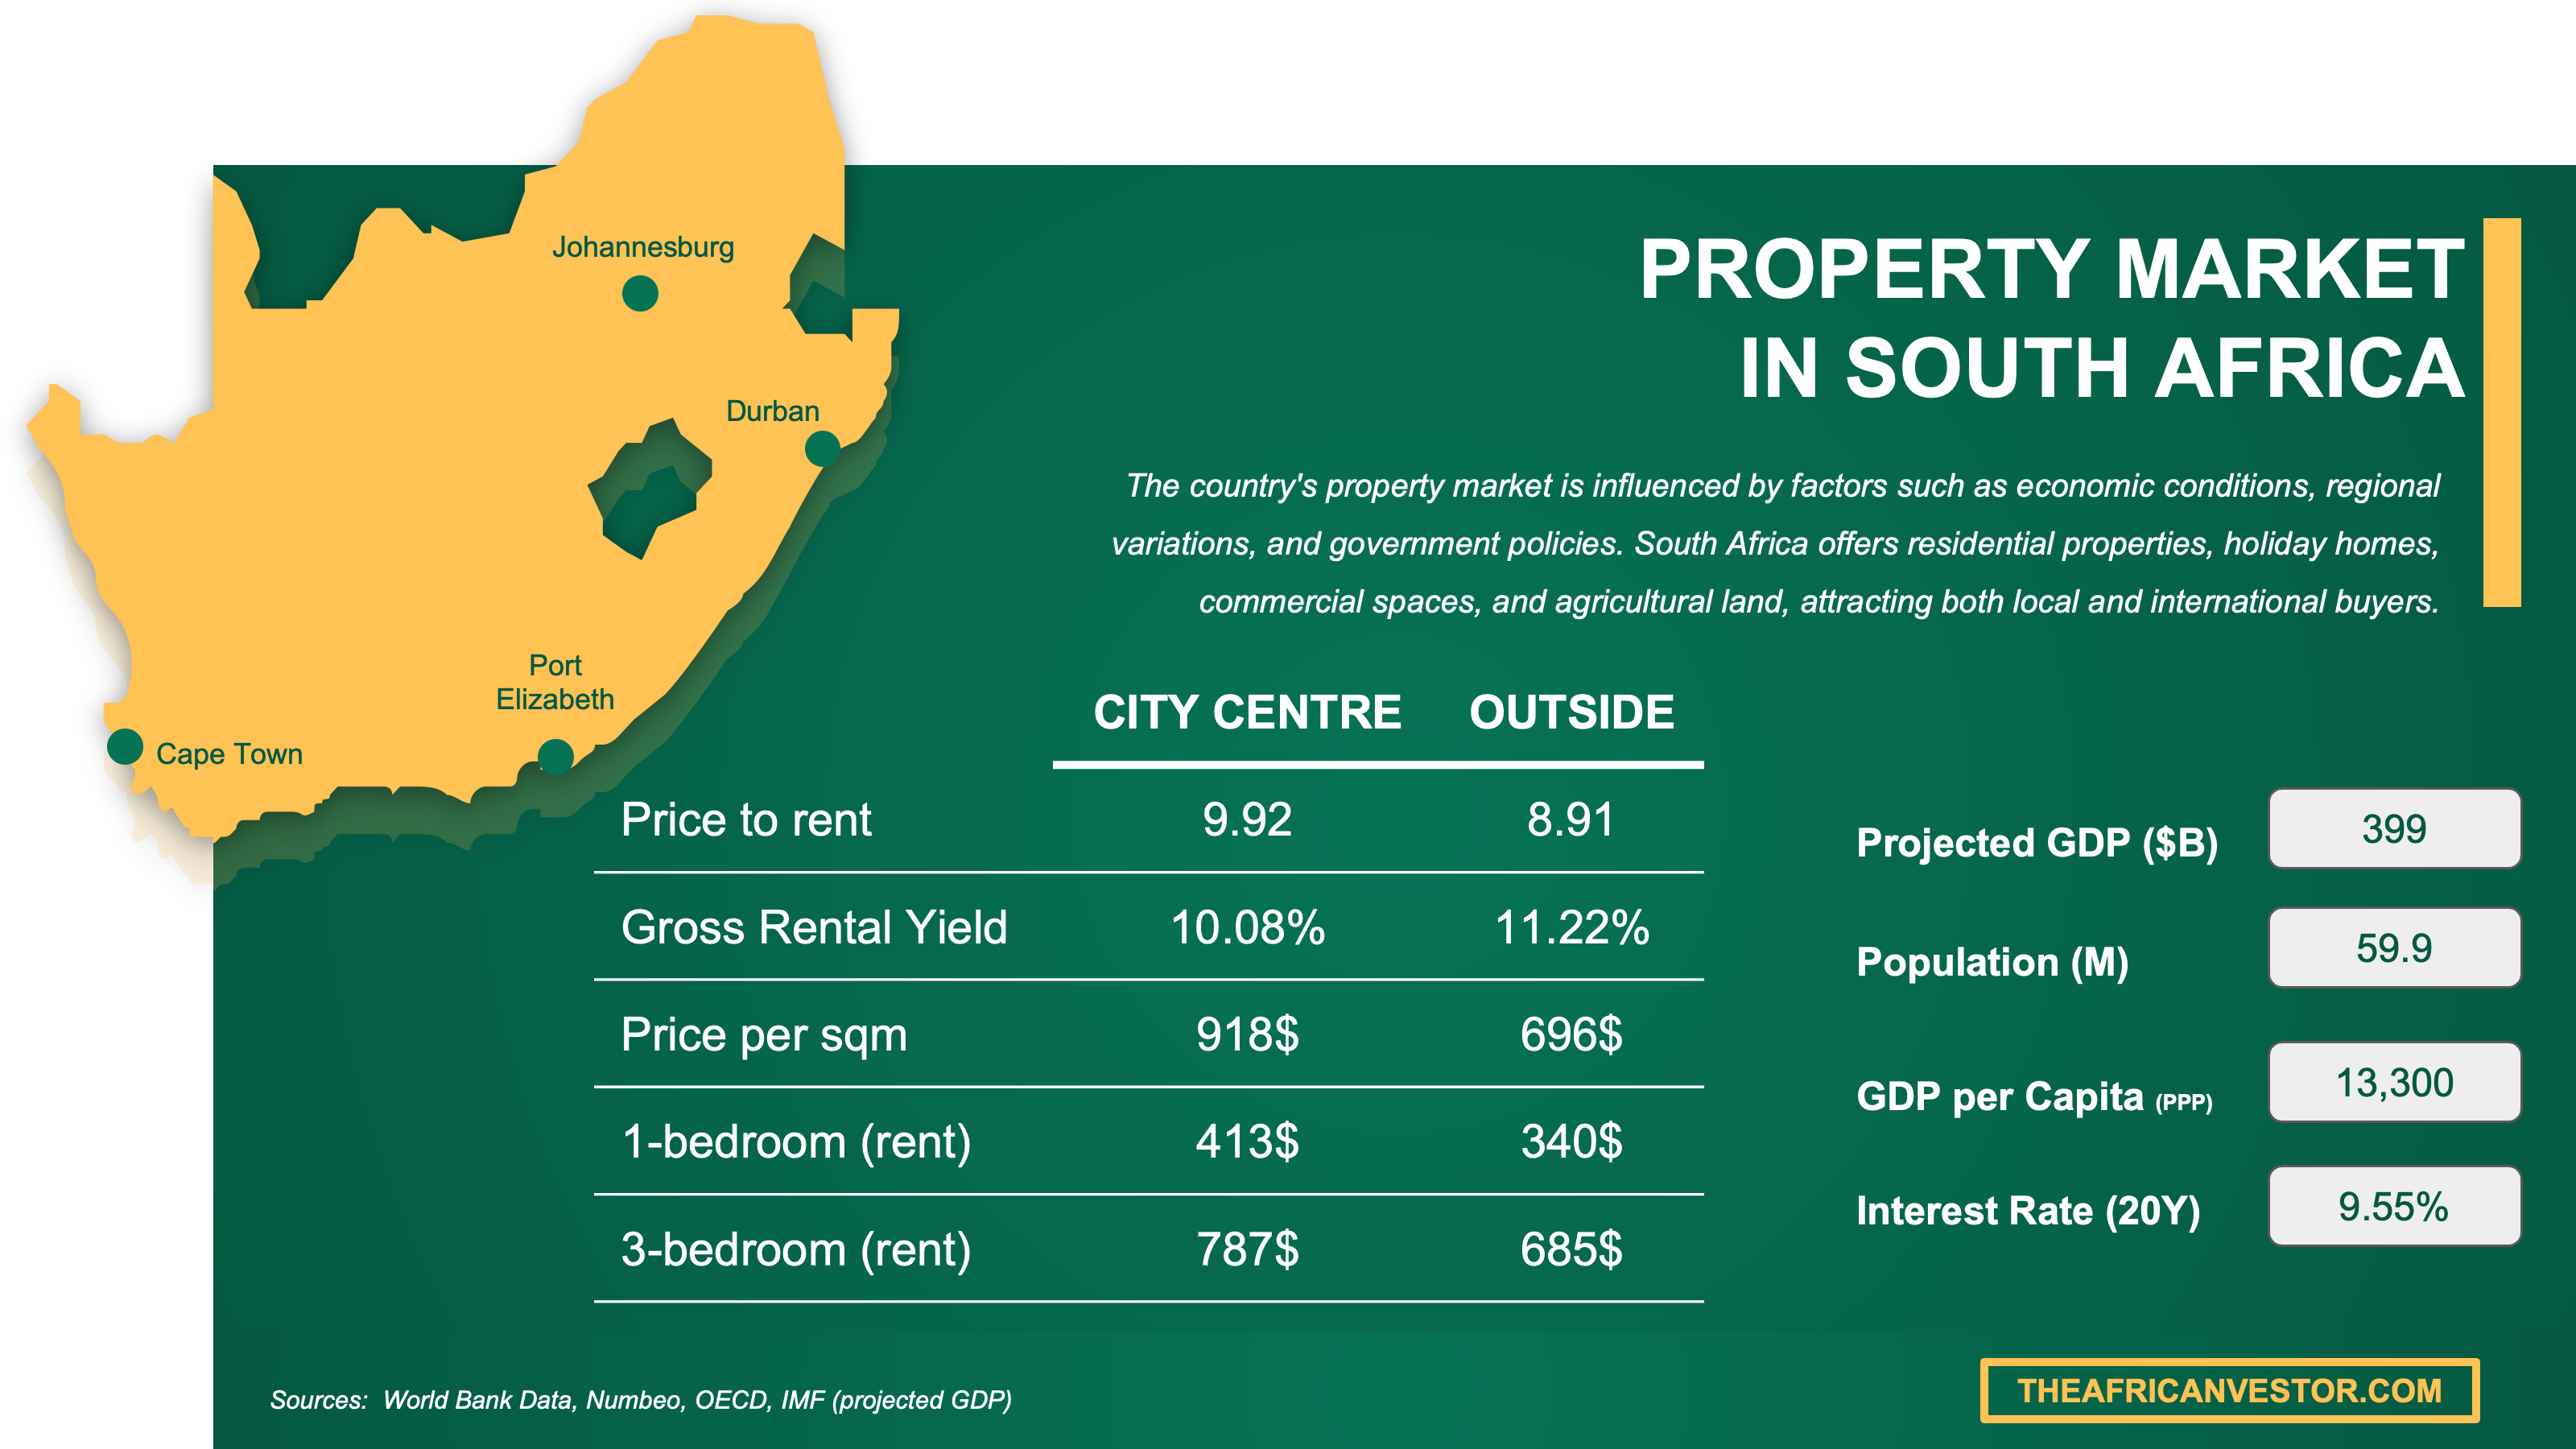
We have made this infographic to give you a quick and clear snapshot of the property market in South Africa. It highlights key facts like rental prices, yields, and property costs both in city centers and outside, so you can easily compare opportunities. We’ve done some research and also included useful insights about the country’s economy, like GDP, population, and interest rates, to help you understand the bigger picture.
Are homes overpriced, or fairly priced in South Africa as of 2026?
Are homes overpriced versus rents or versus incomes in South Africa as of 2026?
As of 2026, South Africa homes look fairly priced versus rents in many apartment and townhouse markets, but expensive versus incomes for ordinary wage earners because bond repayments remain high.
The estimated price-to-rent ratio in South Africa is roughly 14 to 18 years for mainstream rental stock, which is close to a balanced market, while prime Cape Town homes can sit well above that.
The estimated price-to-income multiple is around 4 to 6 times household income in many middle-income markets and higher in prime Cape Town, which is above the easiest affordability zone for local buyers.
Finally please note that you will have all the indicators you need in our property pack covering the real estate market in South Africa.
Are home prices above the long-term average in South Africa as of 2026?
As of 2026, South Africa home prices are above their long-term nominal average, but not wildly above their long-term inflation-adjusted trend.
The recent 12-month price change is strongest in the Western Cape and weaker in Gauteng, which is faster than the 2023 to 2024 soft period but still not a national boom.
In real terms, South Africa property prices look much less stretched than the nominal index suggests, because inflation has absorbed part of the price increase since the last cycle peak.
Get fresh and reliable information about the market in South Africa
Don't base significant investment decisions on outdated data. Get updated and accurate information.

What local changes could move prices in South Africa as of 2026?
Are big infrastructure projects coming to South Africa as of 2026?
As of 2026, the biggest infrastructure price driver is not one single project but the national R1.07 trillion public-sector infrastructure programme, which could support property values where transport, water, energy and logistics delivery actually improves daily life.
The timeline is medium term, because the spending is planned across the 2026 medium-term expenditure framework, so buyers should think in years, not months.
For the latest updates on the local projects, you can read our property market analysis about South Africa here.
Are zoning or building rules changing in South Africa as of 2026?
The most important rule trend in South Africa is densification near jobs, transport and services, not a single national zoning shock that would suddenly reprice all homes.
As of 2026, likely zoning and building rule changes should support apartments, townhouses and infill housing more than large detached homes, especially where municipalities want compact growth.
The most affected areas are likely Cape Town’s Observatory, Woodstock, Claremont, Bellville and Sea Point, Johannesburg’s Rosebank, Sandton and Midrand, and Pretoria’s Hatfield, Menlyn and Brooklyn.
Are foreign-buyer or mortgage rules changing in South Africa as of 2026?
As of 2026, South Africa does not appear to be moving toward a major foreign-buyer ban, so mortgage affordability matters much more for prices than foreign-buyer regulation.
The most likely foreign-buyer constraint remains practical enforcement through exchange control, bank lending and higher equity needs for non-resident buyers, rather than a sudden ban.
The most likely mortgage change is tighter or more cautious bank assessment if rates and household stress stay high, which would affect marginal buyers more than cash buyers.
You can also read our latest update about mortgage and interest rates in South Africa.
Buying real estate in South Africa can be risky
An increasing number of foreign investors are showing interest. However, 90% of them will make mistakes. Avoid the pitfalls with our comprehensive guide.

Will it be easy to find tenants in South Africa as of 2026?
Is the renter pool growing faster than new supply in South Africa as of 2026?
As of 2026, the renter pool in South Africa appears to be growing faster than good-quality rental supply in the best areas, but not equally across the whole country.
The strongest demand signal is continued movement toward better-serviced and job-rich areas, especially Cape Town, Stellenbosch, Somerset West, Sandton, Rosebank, Waterfall, Hatfield, Menlyn, Umhlanga and Ballito.
The supply signal is mixed because residential building activity is recovering in value, but completions are uneven and new stock is not always where tenants most want to live.
Are days-on-market for rentals falling in South Africa as of 2026?
As of 2026, rental days-on-market in South Africa are likely falling in prime rental nodes, with well-priced homes often taking about 20 to 45 days to let.
The best areas can lease much faster than weaker areas, with Cape Town’s City Bowl, Atlantic Seaboard and Southern Suburbs often tighter than slower inland or weaker-income suburbs.
One reason rental days-on-market is falling in strong South Africa locations is that many households still cannot afford to buy, so good rental homes absorb demand quickly.
Are vacancies dropping in the best areas of South Africa as of 2026?
As of 2026, vacancies appear to be dropping or staying low in the best South Africa rental areas, especially Sea Point, Green Point, Gardens, Claremont, Rondebosch, Bellville, Sandton, Rosebank, Waterfall, Hatfield, Menlyn, Umhlanga and Ballito.
The estimated vacancy proxy in those best areas is roughly 2% to 5%, compared with a broader South Africa rental market that is more mixed and can be closer to 5% to 8% in weaker locations.
A practical sign of tightening in South Africa is that landlords in good nodes can choose between stronger tenant profiles, not just raise asking rent.
By the way, we’ve written a blog article detailing what are the current rent levels in South Africa.
Make a profitable investment in South Africa
Better information leads to better decisions. Save time and money. Download our data.
Am I buying into a tightening market in South Africa as of 2026?
Is for-sale inventory shrinking in South Africa as of 2026?
As of 2026, South Africa for-sale inventory is hard to measure nationally, but we estimate prime Western Cape stock is about 10% to 20% tighter than the weak 2022 to 2023 period.
The closest months-of-supply proxy is roughly 4 to 6 months in strong areas and 6 to 9 months in slower areas, compared with about 6 months as a simple balanced-market guide.
The most likely reason inventory is shrinking in the best South Africa areas is that owners of well-located homes have little pressure to discount while rents and prices keep rising.
Are homes selling faster in South Africa as of 2026?
As of 2026, homes in South Africa are likely selling faster than during the 2023 to 2024 weak patch, with a realistic national median time-to-sell around 70 to 90 days.
The estimated year-over-year improvement is about 5 to 15 fewer days in stronger markets, while overpriced homes can still sit for several months.
Are new listings slowing down in South Africa as of 2026?
As of 2026, we are not fully confident in one national new-listings estimate for South Africa, but strong areas appear to have fewer motivated sellers than they had in the weak market.
Seasonally, South Africa listings often improve after holiday periods and around relocation cycles, but current prime-area supply still looks low rather than abundant.
The most plausible reason new listings are slowing in the best South Africa areas is seller caution, because owners do not want to give up scarce homes in secure, serviced locations.
Is new construction failing to keep up in South Africa as of 2026?
As of 2026, new construction is not keeping up in the most desirable South Africa nodes, although the national supply picture is too uneven for one simple shortage number.
Stats SA building data shows residential plans and completions improving in some categories, but completions remain volatile and not always concentrated in the highest-demand locations.
The biggest bottleneck is not just permits, but the combined cost of land, construction finance, municipal capacity and serviced infrastructure in the places where buyers and tenants actually want to live.
Get to know the market before buying a property in South Africa
Better information leads to better decisions. Get all the data you need before investing a large amount of money.
Will it be easy to sell later in South Africa as of 2026?
Is resale liquidity strong enough in South Africa as of 2026?
As of 2026, resale liquidity in South Africa is strong enough in mainstream price bands and prime nodes, but weaker for overpriced luxury homes and homes in weak-service municipalities.
The estimated median days-on-market for resale homes is about 70 to 90 days nationally, compared with roughly 60 to 90 days as a healthy liquidity benchmark for a normal South Africa market.
The characteristic that most improves resale liquidity in South Africa is a practical location near jobs, schools, security, transport, shopping and reliable municipal services.
Is selling time getting longer in South Africa as of 2026?
As of 2026, selling time in South Africa is probably not getting longer in good areas, and it has likely shortened slightly versus the 2023 to 2024 weak period.
The current realistic range is about 45 to 70 days in the strongest Cape Town and prime Gauteng nodes, 70 to 90 days nationally, and 90 to 120 days or more for weaker or overpriced homes.
Selling time can still lengthen quickly in South Africa when sellers price above what buyers can finance, because the 10.50% prime rate keeps affordability tight.
Is it realistic to exit with profit in South Africa as of 2026?
As of 2026, the likelihood of exiting with a profit in South Africa is medium to high if you hold a good property for several years and avoid buying above market value.
The minimum holding period that most often makes profit realistic is around five years, because transfer duty, agent commission, maintenance, levies and tax can absorb short-term gains.
For a typical R2 million South Africa property, the total round-trip cost drag can easily reach about R160,000 to R240,000, or roughly $10,000 to $15,000 and €8,500 to €13,000 at mid-June 2026 exchange rates.
The clearest factor that increases profit odds is buying a mainstream home below market in a deep-demand area, such as Cape Town’s Southern Suburbs, Somerset West, Sandton, Rosebank, Waterfall, Pretoria East, Umhlanga or Ballito.

We made this infographic to show you how property prices in South Africa compare to other big cities across the region. It breaks down the average price per square meter in city centers, so you can see how cities stack up. It’s an easy way to spot where you might get the best value for your money. We hope you like it.
What sources have we used to write this blog article?
Whether it’s in our blog articles or the market analyses included in our property pack about South Africa, we always rely on the strongest methodology we can, and we don’t throw out numbers at random.
We also aim to be fully transparent, so below we’ve listed the authoritative sources we used, and explained how we used them and the methods behind our estimates.
| Source | Why this source is reliable | How we used it |
|---|---|---|
| Statistics South Africa RPPI, January 2026 | Stats SA is South Africa’s official national statistics agency. | We used it as the core official house-price source. We compared national, provincial, metro, freehold and sectional-title price trends. |
| Stats SA selected building statistics, March 2026 | It is the official monthly source for building plans and completions. | We used it to test whether new residential supply is catching up. We compared Q1 2026 building activity with prior periods. |
| South African Reserve Bank current market rates | SARB is South Africa’s central bank and official rate source. | We used it to anchor mortgage affordability in June 2026. We linked the repo and prime rates to buyer demand. |
| SARB Quarterly Bulletin, March 2026 | SARB publishes official macro and household-finance data. | We used it to judge household debt and affordability stress. We cross-checked it against mortgage-market data. |
| Stats SA GDP Q1 2026 release | It reports official South Africa economic growth data. | We used it to judge the economic backdrop for housing demand. We treated slow growth as supportive, not boom-like. |
| Stats SA QLFS Q1 2026 | It reports South Africa’s official labour-market survey. | We used it as a brake on the bullish case. We treated high unemployment as a limit on broad price growth. |
| ooba oobarometer | ooba is a major South African bond originator. | We used it to read live buyer demand and purchase-price trends. We cross-checked it against BetterBond and SARB data. |
| BetterBond Property Brief, April 2026 | BetterBond has broad mortgage-application data from a major lending channel. | We used it to estimate demand recovery and affordability. We compared loan-application growth with price and supply data. |
| BetterBond Property Brief, May 2026 | It gives recent South Africa home-loan market signals. | We used it to assess whether demand was still improving. We also used its caution on tighter lending criteria. |
| PayProp Rental Index Q4 2025 | PayProp tracks actual managed rental payments. | We used it to anchor rent growth and provincial rent levels. We used Western Cape rent strength as a prime-area signal. |
| PayProp Rental Index hub | It is a recurring rental index for South Africa. | We used it as the rental-market dataset family. We cross-checked its direction with TPN rental data. |
| TPN 2026 rental-market outlook | TPN combines rental payment, vacancy and landlord data. | We used it for the 2026 rental escalation range. We treated its forecast as a realistic national rental-growth band. |
| Lightstone Property | Lightstone is a major deeds-based South Africa property-data provider. | We used it for transaction-market context and sentiment. We treated it as a private cross-check against bank data. |
| National Treasury Budget Review 2026 | National Treasury is South Africa’s official budget source. | We used it to assess infrastructure spending and policy direction. We focused on projects that can improve residential locations. |
| GTAC Bi-Annual Infrastructure Trends Report 2026 | GTAC uses government infrastructure and budget data. | We used it to quantify the infrastructure pipeline. We linked the programme to long-run location quality, not instant price spikes. |
| South African Government Expropriation Act 13 of 2024 | This is the official government publication of the Act. | We used it for property-rights and policy-risk context. We did not treat it as a direct short-term residential price crash trigger. |
Don't buy the wrong property, in the wrong area of South Africa
Buying real estate is a significant investment. Don't rely solely on your intuition. Gather the right information to make the best decision.