Authored by the expert who managed and guided the team behind the South Africa Property Pack
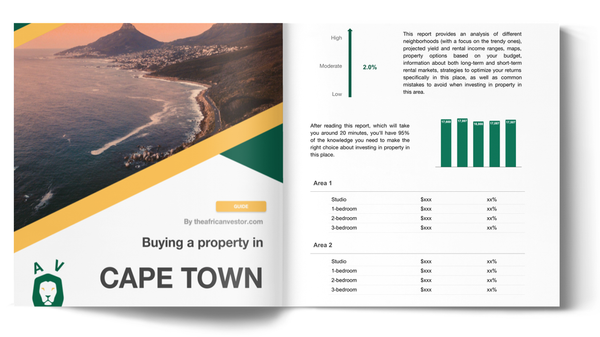
Get all the data you need about the real estate market in Cape Town
We constantly update this blog post so buyers can follow the Cape Town property market with fresh public data, not old assumptions.
As of June 2026, Cape Town is still one of South Africa’s strongest residential property markets, but the best deals are no longer easy.
The clearest message is simple: buying in Cape Town in 2026 can make sense, but only if the property is well located, fairly priced and easy to rent or resell later.
And if you’re planning to buy a property in this place, you may want to download our pack covering the real estate market in Cape Town.
So, is now a good time?
Rather yes, June 2026 is a reasonable time to buy a property in Cape Town if you avoid overpaying in the hottest coastal and school-linked areas.
The strongest signal is that official Cape Town residential prices were still rising much faster than most South African metros in early 2026.
Another strong signal is that Cape Town rental demand remains solid, especially in City Bowl, Atlantic Seaboard, Southern Suburbs, Century City, Table View and Durbanville.
Other strong signals are land scarcity, population pressure, tourism demand, better municipal performance and limited effective supply in the most wanted suburbs.
The best strategies are to buy a well-managed apartment, townhouse or family home in a liquid area, and to prefer long-term rental demand unless the short-term rental rules and building rules are very clear.
This is not financial or investment advice because we do not know your personal situation, so you should still do your own research before buying property in Cape Town.

Is it smart to buy now in Cape Town, or should I wait as of 2026?
Do real estate prices look too high in Cape Town as of 2026?
As of 2026, Cape Town property prices look about 10% to 18% above a comfortable affordability level, with prime coastal houses more stretched than ordinary apartments and townhouses.
This fits what buyers see on the ground in Cape Town listings, because fairly priced homes in Sea Point, Gardens, Claremont, Rondebosch, Durbanville and Table View still move quickly, while ambitious asking prices often need a cut.
The second signal is that Cape Town apartments look less stretched than trophy houses, so a buyer should not treat a sectional-title flat in Observatory like a villa-style house in Camps Bay.
You can also read our latest update regarding the housing prices in Cape Town.
Does a property price drop look likely in Cape Town as of 2026?
As of 2026, the risk of a meaningful Cape Town property price drop over the next 12 months looks low to medium, not high.
A sensible 12-month range is roughly 0% to 3% down in weaker or overpriced pockets, and 4% to 8% up in good mainstream areas.
The biggest macro risk for Cape Town property prices is mortgage affordability, because a prime rate around 10.50% makes monthly repayments heavy for debt-funded buyers.
That risk is real but not extreme in mid-2026, because inflation and interest rates are restrictive but not pointing to a broad forced-selling wave in Cape Town.
Finally, please note that we cover the price trends for next year in our pack about the property market in Cape Town.
Could property prices jump again in Cape Town as of 2026?
As of 2026, the chance of another Cape Town property price surge is medium in the best suburbs and lower across the whole metro.
A realistic upside range is about 5% to 8% for Cape Town overall over the next year, with 8% to 12% possible in scarce micro-markets if rates ease.
The biggest demand-side trigger would be cheaper mortgage credit, because lower repayments would bring more family buyers and investors back into Cape Town at the same time.
Please also note that we regularly publish and update real estate price forecasts for Cape Town here.
Are we in a buyer or a seller market in Cape Town as of 2026?
As of 2026, Cape Town is still seller-leaning in desirable areas, but buyers have room to negotiate on overpriced luxury homes and weak body-corporate buildings.
There is no perfect official months-of-inventory number for Cape Town, but our closest estimate is around 3 to 4 months in strong nodes, which usually favours sellers.
Our estimate is that about 15% to 25% of visible listings need some price adjustment in weaker or overpriced pockets, which means sellers have leverage only when the asking price is realistic.
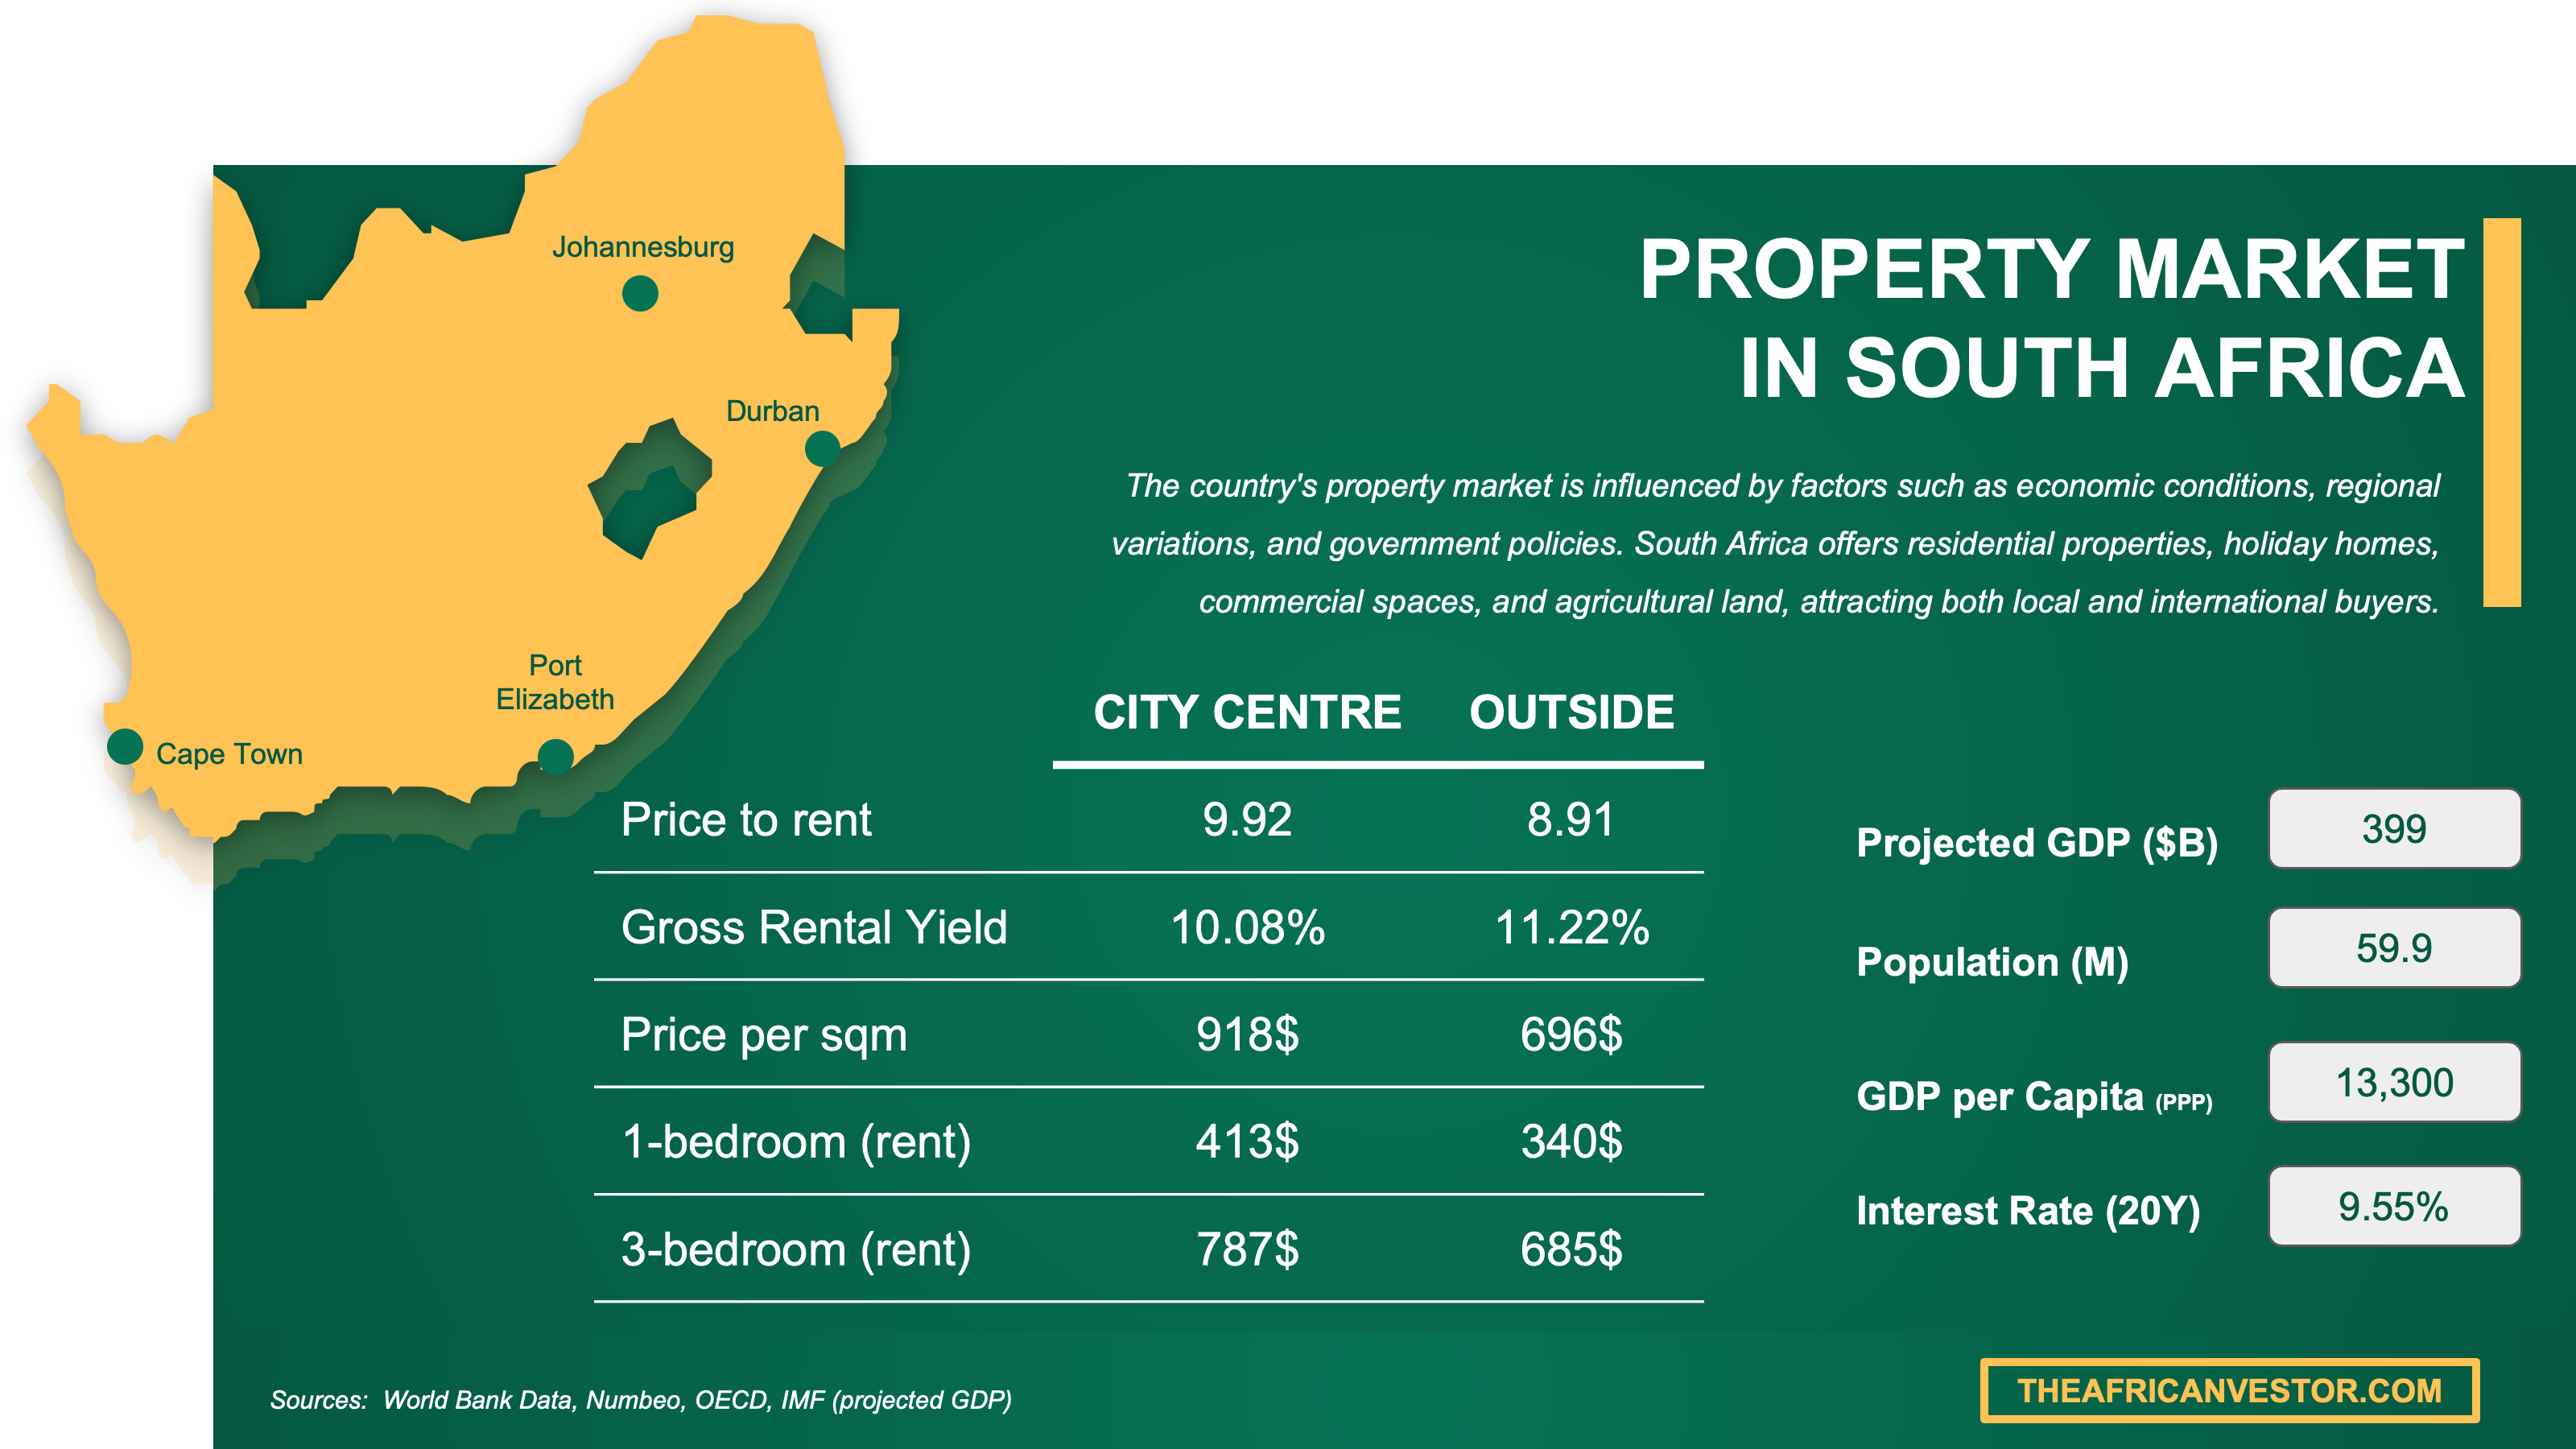
We have made this infographic to give you a quick and clear snapshot of the property market in South Africa. It highlights key facts like rental prices, yields, and property costs both in city centers and outside, so you can easily compare opportunities. We’ve done some research and also included useful insights about the country’s economy, like GDP, population, and interest rates, to help you understand the bigger picture.
Are homes overpriced, or fairly priced in Cape Town as of 2026?
Are homes overpriced versus rents or versus incomes in Cape Town as of 2026?
As of 2026, Cape Town homes look more overpriced versus local incomes than versus rents, which means buyers feel squeezed but investors can still find support in strong rental areas.
Our estimated Cape Town price-to-rent ratio is roughly 17 to 22 in good rental nodes, compared with about 15 to 18 for a more balanced buy-versus-rent market.
Our estimated Cape Town price-to-income multiple is roughly 7 to 9 for many ordinary buyers, compared with about 4 to 5 as a more comfortable affordability benchmark.
Finally please note that you will have all the indicators you need in our property pack covering the real estate market in Cape Town.
Are home prices above the long-term average in Cape Town as of 2026?
As of 2026, Cape Town home prices are clearly above their long-term trend, with the official resold-property index around one-third higher than its late-2020 base.
The latest official 12-month signal was double-digit growth for the City of Cape Town in January 2026, which is faster than Cape Town’s more normal long-run pace.
After inflation, Cape Town prices still look high versus the recent cycle, but the market is not as overheated as a classic boom with 20% to 30% yearly growth.
Get fresh and reliable information about the market in Cape Town
Don't base significant investment decisions on outdated data. Get updated and accurate information.

What local changes could move prices in Cape Town as of 2026?
Are big infrastructure projects coming to Cape Town as of 2026?
As of 2026, the biggest local infrastructure support is Cape Town’s multi-year municipal infrastructure programme, which should help prices most in well-connected areas that benefit from better water, sanitation, electricity, roads and public spaces.
The budget cycle is already active for 2026/27, and the practical timeline is gradual because funding, procurement, construction and delivery will spread over several years rather than one sudden handover.
For the latest updates on the local projects, you can read our property market analysis about Cape Town here.
Are zoning or building rules changing in Cape Town as of 2026?
The most important planning direction in Cape Town is not one sudden rule change, but a steady push toward inward growth, densification and mixed-use development.
As of 2026, this should slightly limit price growth in some apartment-heavy corridors over time, but it should also make well-located land more valuable because demand will concentrate near jobs, transport and schools.
The most affected areas are Cape Town CBD, Salt River, Woodstock, Observatory, Bellville, Claremont, Wynberg, Paarden Eiland fringes and parts of the northern corridor.
Are foreign-buyer or mortgage rules changing in Cape Town as of 2026?
As of 2026, there is no clear broad anti-foreign-buyer rule change for Cape Town, so mortgage cost remains the bigger constraint on residential prices.
The most likely foreign-buyer change is not a ban, but tighter reporting, tax administration or compliance checks if affordability becomes more political.
The most likely mortgage change is continued lender caution on deposits, affordability checks and debt service, especially because prime lending rates remain high by recent buyer standards.
You can also read our latest update about mortgage and interest rates in South Africa.
Buying real estate in Cape Town can be risky
An increasing number of foreign investors are showing interest. However, 90% of them will make mistakes. Avoid the pitfalls with our comprehensive guide.

Will it be easy to find tenants in Cape Town as of 2026?
Is the renter pool growing faster than new supply in Cape Town as of 2026?
As of 2026, renter demand in the best parts of Cape Town appears to be growing faster than effective long-term rental supply.
The best demand signal is Cape Town’s mix of population growth, semigration, students, young professionals, remote workers and tourism-linked workers who all need well-located housing.
The best supply signal is that building activity is not creating a large enough flow of completed, affordable and well-located homes to fully ease pressure in the strongest rental nodes.
Are days-on-market for rentals falling in Cape Town as of 2026?
As of 2026, well-priced Cape Town rentals in strong areas often let in about 2 to 4 weeks, and time-to-let looks stable to falling in the best nodes.
The gap is large, because a clean apartment in Sea Point, Green Point, Gardens, Observatory, Claremont, Rondebosch, Century City or Table View can move much faster than an overpriced luxury rental above R25,000 per month.
One reason time-to-let falls in Cape Town is that tenants often compete for the same practical features, especially security, parking, backup power, good management and short commute time.
Are vacancies dropping in the best areas of Cape Town as of 2026?
As of 2026, vacancies look low and likely still tightening in Sea Point, Green Point, Gardens, Vredehoek, Observatory, Claremont, Rondebosch, Century City, Table View and Durbanville.
A fair proxy is that the best Cape Town rental areas are probably near 2% to 4% vacancy, while the broader formal market is closer to the mid-single digits.
A practical sign is that landlords in good Cape Town buildings can be selective about tenant quality without offering large discounts, especially when the unit has parking, security and backup power.
By the way, we’ve written a blog article detailing what are the current rent levels in Cape Town.
Make a profitable investment in Cape Town
Better information leads to better decisions. Save time and money. Download our data.
Am I buying into a tightening market in Cape Town as of 2026?
Is for-sale inventory shrinking in Cape Town as of 2026?
As of 2026, it is hard to measure Cape Town for-sale inventory perfectly, but effective quality stock appears tighter than last year in the best suburbs.
Our closest estimate is about 3 to 4 months of supply in desirable Cape Town areas, compared with about 5 to 6 months for a more balanced market.
The most likely reason is that owners of good Cape Town properties can rent them out or hold them, so fewer owners feel forced to sell unless the price is attractive.
Are homes selling faster in Cape Town as of 2026?
As of 2026, correctly priced Cape Town homes in strong areas often sell in about 45 to 75 days, while the best-priced stock can sell faster.
Compared with last year, our estimate is that median selling time is stable to slightly shorter in liquid suburbs, but longer for overpriced luxury homes.
Are new listings slowing down in Cape Town as of 2026?
As of 2026, we are not fully confident in a precise new-listings number, but quality new listings in prime Cape Town areas look about 5% to 15% below a balanced level.
Cape Town usually sees listing activity improve outside the deepest winter months, but strong rental income and limited replacement options mean many owners still hold good properties.
The most plausible reason is seller caution, because owners know they may struggle to buy back into Sea Point, Southern Suburbs, Durbanville or City Bowl at a reasonable price.
Is new construction failing to keep up in Cape Town as of 2026?
As of 2026, new construction in Cape Town appears to be failing to keep up with effective demand in the exact places where buyers and tenants most want to live.
The latest building statistics show residential plans improved nationally in early 2026, but that does not mean completed homes are arriving fast enough in central, coastal and school-linked Cape Town nodes.
The biggest bottleneck is land, because mountain, ocean, protected land, heritage rules, infrastructure limits and long commutes make Cape Town supply harder than in more expandable metros.
Get to know the market before buying a property in Cape Town
Better information leads to better decisions. Get all the data you need before investing a large amount of money.
Will it be easy to sell later in Cape Town as of 2026?
Is resale liquidity strong enough in Cape Town as of 2026?
As of 2026, resale liquidity in Cape Town is strong for realistic prices, especially where both owner-occupiers and tenants clearly want the same property.
Our estimated median days-on-market is about 45 to 75 days for good resale homes, which is healthier than a slow market where many listings sit for more than 90 days.
The single feature that most improves resale liquidity in Cape Town is obvious future demand, such as a good school catchment, walkable lifestyle node, sea access, security, parking or easy commute.
Is selling time getting longer in Cape Town as of 2026?
As of 2026, selling time in Cape Town is not generally getting longer for fairly priced mainstream homes, but it is getting longer for overpriced luxury stock.
The current realistic range is about 30 to 60 days for excellent listings, 45 to 75 days for normal good listings, and more than 90 days for stretched or highly personalised properties.
The clearest reason selling time can lengthen in Cape Town is affordability pressure, because buyers may love the property but still fail the monthly repayment test at high prime rates.
Is it realistic to exit with profit in Cape Town as of 2026?
As of 2026, the chance of selling a well-bought Cape Town property at a profit is medium to high over a normal holding period, but low over a short speculative hold.
The minimum holding period that usually makes sense is about 5 years, because transfer duty, legal fees, agent commission, maintenance and levies eat into short-term gains.
A practical round-trip cost drag is often around 8% to 12% of the property price, which is about R200,000 to R300,000, about $12,000 to $19,000, or about €11,000 to €16,000 on a R2.5 million home.
The clearest factor that improves profit odds in Cape Town is buying below market in a liquid node where both tenants and future buyers are easy to identify.

We made this infographic to show you how property prices in South Africa compare to other big cities across the region. It breaks down the average price per square meter in city centers, so you can see how cities stack up. It’s an easy way to spot where you might get the best value for your money. We hope you like it.
What sources have we used to write this blog article?
Whether it’s in our blog articles or the market analyses included in our property pack about Cape Town, we always rely on the strongest methodology we can, and we don’t throw out numbers at random.
We also aim to be fully transparent, so below we’ve listed the authoritative sources we used, and explained how we used them and the methods behind our estimates.
| Source | Why we trust it | How we used it |
|---|---|---|
| Stats SA Residential Property Price Index, January 2026 | Stats SA is South Africa’s official statistics agency. | We used it as the main official price anchor. We compared Cape Town with other metros and checked houses against sectional-title homes. |
| Stats SA Residential Property Price Index, April 2025 | It gives an earlier point in the same official series. | We used it to see whether Cape Town’s strength was already visible in 2025. We treated it as a trend check. |
| Stats SA Selected Building Statistics, March 2026 | It tracks official private-sector building plans and completions. | We used it to test whether new supply is accelerating enough. We focused on effective residential supply, not just planned projects. |
| Stats SA Census 2022 Statistical Release | It is the official population baseline for South Africa. | We used it to understand demographic pressure. We connected population growth to long-term housing demand in Cape Town. |
| City of Cape Town Census 2022 Trends and Changes | It is Cape Town’s own reading of official census data. | We used it to localise the population story. We checked whether demand pressure looked structural rather than temporary. |
| SARB MPC announcements | SARB is South Africa’s official central bank. | We used it to verify the interest-rate backdrop. We linked mortgage costs to buyer affordability in Cape Town. |
| SARB current market rates | It is an official source for current financial conditions. | We used it to check financing pressure in mid-June 2026. We used rates to judge crash risk and buyer power. |
| City of Cape Town 2026/27 budget | The city budget shows official spending and rates priorities. | We used it to assess infrastructure support. We also checked whether municipal charges could weigh on affordability. |
| City of Cape Town Municipal Spatial Development Framework | It is Cape Town’s official long-term spatial plan. | We used it to assess densification and inward growth. We linked planning direction to future apartment and townhouse supply. |
| City of Cape Town Integrated Human Settlements Sector Plan 2026/27 Review | It is the city’s official housing-delivery plan. | We used it to assess affordable and social housing pressure. We treated delivery plans as policy signals, not price guarantees. |
| TPN Residential Rental Monitor Q1 2025 | TPN is a recognised rental credit and tenant data provider. | We used it to assess tenant payment quality. We cross-checked rental strength with PayProp and vacancy signals. |
| TPN Reports | TPN reports are widely used by South African landlords. | We used them for rental-market structure and vacancy signals. We avoided relying on paid or incomplete detail alone. |
| PayProp Rental Index | PayProp tracks processed rental payments across South Africa. | We used it to cross-check rent growth and affordability. We treated it as strong private-sector evidence alongside official data. |
| FNB Property Barometer methodology page | FNB is one of South Africa’s largest mortgage lenders. | We used it to understand repeat-sales methodology. We used lender-side evidence as a check on official price signals. |
| Lightstone Property Newsletter, June 2025 | Lightstone is a major South African property-data provider. | We used it to cross-check Western Cape outperformance. We treated it carefully because it is private market data. |
| Wesgro and Cape Town Air Access passenger data | Wesgro is the official tourism and investment agency for the region. | We used it to assess tourism and short-stay demand pressure. We connected airport growth to rental demand in inner and coastal nodes. |
Don't buy the wrong property, in the wrong area of Cape Town
Buying real estate is a significant investment. Don't rely solely on your intuition. Gather the right information to make the best decision.
Related blog posts
- What are the best areas to buy a property in property in Cape Town?