Authored by the expert who managed and guided the team behind the South Africa Property Pack
Get all the data you need about the real estate market in Cape Town
Rents in Cape Town in 2026 are high by South African standards, but the city still has very different prices from one neighborhood to another.
We constantly update this blog post so that landlords, buyers and investors can use fresh Cape Town rental data instead of old market guesses.
The figures below focus on long-term residential rentals in Cape Town, not short-term holiday lets or luxury vacation homes.
And if you’re planning to buy a property in this place, you may want to download our pack covering the real estate market in Cape Town.

What are typical rents in Cape Town as of 2026?
What's the average monthly rent for a studio in Cape Town as of 2026?
As of 2026, the average monthly rent for a studio in Cape Town is about R9,000, which is roughly $490 or €450.
In practice, most Cape Town studios rent for about R6,500 to R18,000 per month, or roughly $350 to $970 and €325 to €900.
This wide Cape Town studio rent range mainly depends on the suburb, building security, parking, views, furniture, backup power and distance to the CBD, UCT or the Atlantic Seaboard.
What's the average monthly rent for a 1-bedroom in Cape Town as of 2026?
As of 2026, the average monthly rent for a 1-bedroom apartment in Cape Town is about R13,500, which is roughly $730 or €675.
For most tenants, a normal 1-bedroom rental in Cape Town sits between R8,000 and R24,000 per month, or about $430 to $1,300 and €400 to €1,200.
The cheapest 1-bedroom rents in Cape Town are usually in Bellville, Goodwood and Parklands, while the highest are usually in Sea Point, Green Point and De Waterkant.
What's the average monthly rent for a 2-bedroom in Cape Town as of 2026?
As of 2026, the average monthly rent for a 2-bedroom apartment in Cape Town is about R18,500, which is roughly $1,000 or €925.
Most 2-bedroom apartments in Cape Town rent for about R11,500 to R45,000 per month, or roughly $620 to $2,430 and €575 to €2,250.
The cheapest 2-bedroom rents in Cape Town are often in Bellville, Parklands and Goodwood, while the most expensive 2-bedroom rents are in Camps Bay, Clifton, the Waterfront and Bantry Bay.
By the way, you will find much more detailed rent ranges in our property pack covering the real estate market in Cape Town.
What's the average rent per square meter in Cape Town as of 2026?
As of 2026, the average residential rent in Cape Town is about R245 per square meter per month, which is roughly $13 or €12 per square meter.
Across Cape Town, a realistic rent range is about R150 to R500 per square meter per month, or roughly $8 to $27 and €8 to €25 per square meter.
Cape Town rents per square meter are generally higher than most South African cities because central Cape Town, the Atlantic Seaboard and the Southern Suburbs have tighter supply and stronger tenant demand.
In Cape Town, rent per square meter moves above average when a property has sea views, mountain views, secure parking, modern finishes, backup power or a walkable central location.
How much have rents changed year-over-year in Cape Town in 2026?
As of 2026, average long-term rents in Cape Town are up about 7% to 9% year over year.
This rent growth in Cape Town is mainly driven by low vacancy, semigration into the Western Cape, student demand, expat demand and strong demand near central and coastal suburbs.
Compared with 2025, Cape Town rent growth in 2026 looks slightly stronger in well-located apartments, especially where tenants compete for secure, modern and power-resilient homes.
What's the outlook for rent growth in Cape Town in 2026?
As of 2026, a realistic rent-growth outlook for Cape Town is about 6% to 8% for the next year if the market stays tight.
The main drivers are continued migration into Cape Town, limited good-quality rental supply, job access, student demand, tourism pressure and tenant demand for safe buildings with backup power.
The strongest Cape Town rent growth should be in Sea Point, Green Point, Gardens, Woodstock, Observatory, Claremont, Century City, Durbanville and Parklands.
The main risks are weaker household income, overpriced luxury listings, higher landlord costs, more new supply or a sudden slowdown in semigration and expat demand.
Get fresh and reliable information about the market in Cape Town
Don't base significant investment decisions on outdated data. Get updated and accurate information.

Which neighborhoods rent best in Cape Town as of 2026?
Which neighborhoods have the highest rents in Cape Town as of 2026?
As of 2026, the top high-rent neighborhoods in Cape Town are Camps Bay, the Waterfront and Clifton, where strong 2-bedroom rents can often sit between R35,000 and R70,000, or about $1,890 to $3,780 and €1,750 to €3,500.
These Cape Town neighborhoods command premium rents because tenants pay for ocean views, mountain views, security, prestige, walkability, restaurants, beach access and the option to use similar homes for short stays.
The typical tenants in these high-rent Cape Town neighborhoods are expats, senior professionals, wealthy semigrants, corporate tenants, retirees and families who want lifestyle more than low monthly rent.
By the way, we’ve written a blog article detailing Sources and methodology: we checked Property24, Private Property and PayProp. We discounted unusual luxury listings before forming the rent range. We used our own Cape Town premium-area comparisons too.
Where do young professionals prefer to rent in Cape Town right now?
The top Cape Town neighborhoods for young professionals are Sea Point, Gardens and Woodstock, with Green Point, Observatory, De Waterkant, the CBD, Century City and Claremont also very popular.
Young professionals in these Cape Town neighborhoods usually pay about R11,500 to R24,000 per month, or roughly $620 to $1,300 and €575 to €1,200.
These areas attract young professionals because they offer shorter commutes, restaurants, gyms, nightlife, MyCiTi access, fibre internet, apartment stock and an easier social life than many outer suburbs.
By the way, you will find a detailed tenant analysis in our property pack covering the real estate market in Cape Town.
Where do families prefer to rent in Cape Town right now?
The top Cape Town neighborhoods for families are Claremont, Rondebosch and Durbanville, with Newlands, Kenilworth, Pinelands, Parklands North and Constantia also strong.
Families renting 2-bedroom or 3-bedroom homes in these Cape Town areas usually pay about R16,000 to R38,000 per month, or roughly $865 to $2,050 and €800 to €1,900.
These family-friendly Cape Town suburbs are popular because they offer schools, parking, safer streets, larger homes, gardens, shopping access and quieter living than the CBD or nightlife areas.
Important nearby school options include Rondebosch Boys’ High School, Rustenburg Girls’ High School, Westerford High School, SACS, Herschel Girls School, Durbanville High School and Curro Durbanville.
Which areas near transit or universities rent faster in Cape Town in 2026?
As of 2026, the fastest Cape Town rental areas near transit or universities are Observatory, Rondebosch and the CBD, with Mowbray, Rosebank, Claremont, Bellville, Century City and Table View also strong.
Well-priced rentals in these Cape Town areas often stay listed for only about 7 to 14 days when the unit is clean, secure and correctly priced.
A home within easy walking distance of UCT, a busy MyCiTi route or a strong commuter node can often add R500 to R2,000 per month, or about $27 to $110 and €25 to €100.
Which neighborhoods are most popular with expats in Cape Town right now?
The top Cape Town neighborhoods for expats are Sea Point, Green Point and Gardens, with De Waterkant, Mouille Point, Camps Bay, the CBD, Constantia, Newlands and Hout Bay also popular.
Expats in these Cape Town neighborhoods usually pay about R16,000 to R45,000 per month, or roughly $865 to $2,430 and €800 to €2,250.
These areas appeal to expats because they offer furnished homes, walkability, restaurants, security, views, international communities, easy CBD access and a softer landing than car-dependent suburbs.
The most visible expat groups in these Cape Town areas include British, German, Dutch, French, American and other European residents, plus African professionals relocating to the Western Cape.
And if you are also an expat, you may want to read our Sources and methodology: we compared Private Property, Property24 and PayProp. We treated expat demand as a qualitative driver, not a separate official dataset. We checked it against our premium-rental area analysis.
Get to know the market before buying a property in Cape Town
Better information leads to better decisions. Get all the data you need before investing a large amount of money.
Who rents, and what do tenants want in Cape Town right now?
What tenant profiles dominate rentals in Cape Town?
The top tenant profiles in Cape Town are young professionals, students and families, while expats, semigrants and retirees also matter in central, coastal and Southern Suburbs rentals.
A practical 2026 split is about 35% young professionals, 25% families, 20% students and 20% expats, semigrants, retirees and other tenant groups.
Young professionals usually want studios or 1-bedroom apartments, students want shared or small units near UCT and colleges, and families want 2-bedroom or 3-bedroom homes near schools.
If you want to optimize your cashflow, you can read our Sources and methodology: we used PayProp, TPN and Property24. We inferred tenant shares from rent bands, locations and property types. We then checked the split against our Cape Town tenant profiles.
Do tenants prefer furnished or unfurnished in Cape Town?
In Cape Town in 2026, a practical estimate is that about 35% of tenants prefer furnished rentals and about 65% prefer unfurnished rentals.
A furnished apartment in Cape Town can usually add about R1,000 to R3,000 per month, or roughly $55 to $160 and €50 to €150, when the furniture is modern and useful.
Furnished rentals are most popular with expats, students, digital workers, short-stay corporate tenants and semigrants who are testing Cape Town before buying.
Which amenities increase rent the most in Cape Town?
The five amenities that lift Cape Town rents the most are backup power, secure parking, strong security, sea or mountain views and modern furnishing.
In Cape Town, backup power can add R500 to R1,500, secure parking R800 to R1,500, security 5% to 10%, views 10% to 30%, and furnishing 10% to 20% per month.
In our property pack covering the real estate market in Cape Town, we cover what are the best investments a landlord can make.
What renovations get the best ROI for rentals in Cape Town?
The best rental renovations in Cape Town are backup power, security upgrades, repainting, better lighting and bathroom or kitchen refreshes.
Typical Cape Town costs are R25,000 to R60,000 for backup power, R5,000 to R25,000 for security, R8,000 to R25,000 for repainting and lighting, and R20,000 to R80,000 for kitchen or bathroom refreshes, with rent gains often between R500 and R2,000 per month.
Landlords in Cape Town should usually avoid overbuilding luxury finishes, installing fragile designer materials or spending heavily on features that the target tenant group will not pay extra for.
Make a profitable investment in Cape Town
Better information leads to better decisions. Save time and money. Download our data.
How strong is rental demand in Cape Town as of 2026?
What's the vacancy rate for rentals in Cape Town as of 2026?
As of 2026, the estimated long-term rental vacancy rate in Cape Town is about 2% to 4%.
Prime Cape Town apartments in Sea Point, Green Point, Gardens, Observatory and Claremont can be closer to 1% to 3%, while overpriced luxury homes can sit above 5%.
Compared with the historical average, Cape Town vacancy in 2026 looks low, which gives landlords more pricing power in well-located and correctly priced rentals.
Finally please note that you will have all the indicators you need in our property pack covering the real estate market in Cape Town.
How many days do rentals stay listed in Cape Town as of 2026?
As of 2026, a well-priced long-term rental in Cape Town usually stays listed for about 7 to 21 days.
The realistic Cape Town range is 7 to 14 days for strong central, coastal or student areas, 14 to 30 days for normal suburbs, and more than 45 days for overpriced luxury rentals.
Compared with one year ago, Cape Town rentals in 2026 appear to move faster in mainstream price bands because tenant demand has stayed strong while good stock remains limited.
Which months have peak tenant demand in Cape Town?
The peak rental demand months in Cape Town are January, February and March, with smaller peaks in June, July, October and November.
These seasonal peaks happen because students arrive, jobs restart, families relocate before school terms and some long-term supply gets pulled toward summer and holiday demand.
The slower tenant-demand months in Cape Town are usually April, May, August and early September, especially for properties that are overpriced or poorly presented.
Don't buy the wrong property, in the wrong area of Cape Town
Buying real estate is a significant investment. Don't rely solely on your intuition. Gather the right information to make the best decision.
What will my monthly costs be in Cape Town as of 2026?
What property taxes should landlords expect in Cape Town as of 2026?
As of 2026, a landlord with a R2 million Cape Town apartment should expect property rates of about R14,300 per year, or roughly $775 or €715.
A realistic annual property-rate range in Cape Town is about R10,700 to R21,500 for homes valued between R1.5 million and R3 million, or about $580 to $1,160 and €535 to €1,075.
Cape Town property rates are calculated by applying the City of Cape Town residential rate to the municipal value of the property, before any rebates or special rules.
Please note that, in our property pack covering the real estate market in Cape Town, we cover what exemptions or deductions may be available to reduce property taxes for landlords.
What utilities do landlords often pay in Cape Town right now?
In Cape Town, landlords most often pay municipal rates, refuse, body-corporate levies, building insurance and structural maintenance.
Typical monthly landlord-paid costs can include about R900 to R1,800 for rates, R205 for refuse, R1,500 to R3,500 for levies and R300 to R900 for insurance, or roughly $16 to $190 and €15 to €175 depending on the item.
The common Cape Town practice is that tenants pay electricity, water and internet where the lease and meters allow it, while the owner remains responsible for the municipal account and the building.
How is rental income taxed in Cape Town as of 2026?
As of 2026, rental income in Cape Town is taxed by SARS as part of the landlord’s taxable income, so the final tax rate depends on the landlord’s personal tax bracket.
Landlords can usually deduct expenses such as rates, levies, insurance, repairs, agent fees, advertising, bond interest and accounting costs when those expenses relate to the rental property.
Cape Town landlords should avoid confusing repairs with capital improvements, forgetting to declare furnished-rental income, ignoring short-term-rental income, or assuming municipal bills are the same as tax deductions.
We cover these mistakes, among others, in our Sources and methodology: we relied on SARS, the City of Cape Town and our landlord-cost analysis. We kept the explanation for individual landlords, not companies or trusts. We flagged Cape Town-specific risks around furnished and short-term rentals.
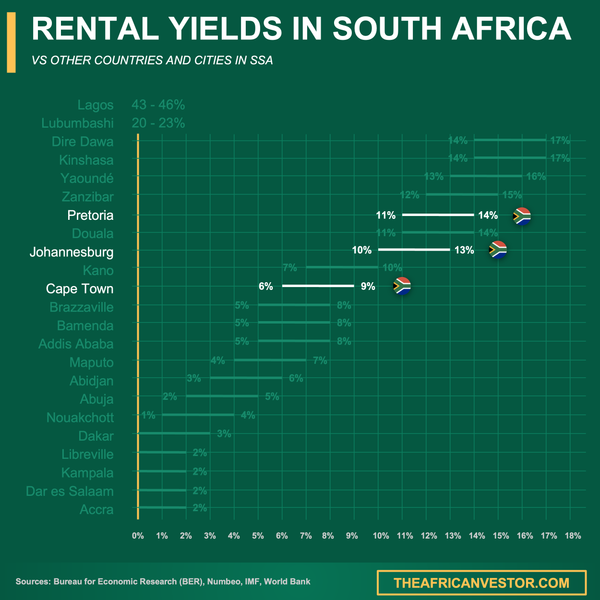
We did some research and made this infographic to help you quickly compare rental yields of the major cities in South Africa versus those in neighboring countries. It provides a clear view of how this country positions itself as a real estate investment destination, which might interest you if you’re planning to invest there.
What sources have we used to write this blog article?
Whether it’s in our blog articles or the market analyses included in our property pack about Cape Town, we always rely on the strongest methodology we can … and we don’t throw out numbers at random.
We also aim to be fully transparent, so below we’ve listed the authoritative sources we used, and explained how we used them and the methods behind our estimates.
| Source | Why we trust it | How we used it |
|---|---|---|
| PayProp Rental Index Q4 2025 release | PayProp tracks real managed rental payments, so it is stronger than simple asking-rent evidence. | We used PayProp as the main anchor for Western Cape average rent and rent growth. We then adjusted the number for Cape Town’s stronger premium areas. |
| PayProp Rental Index hub | The PayProp index is one of the most cited recurring rental datasets in South Africa. | We used the hub to check the direction of national and provincial rental trends. We treated it as achieved-rent context, not as Cape Town neighborhood pricing. |
| Rode Report Q1 2026 | Rode is a long-running property research house used by brokers, valuers and investors. | We used Rode for Cape Town apartment rental momentum and vacancy direction. We cross-checked Rode against PayProp and Stats SA before estimating 2026 growth. |
| Rode Report Q4 2025 | Rode gives useful city and provincial context for rents, vacancies and property cycles. | We used it to understand how tight the Western Cape rental market was entering 2026. We used it to support Cape Town’s strong landlord-pricing position. |
| Stats SA CPI March 2026 tables | Stats SA is South Africa’s official national statistics agency. | We used the actual-rent inflation series as a conservative official check. We did not use it alone because CPI rent data moves more slowly than Cape Town listings. |
| TPN Reports | TPN is a specialist rental credit and vacancy-data provider in South Africa. | We used TPN for tenant-risk and vacancy-market context. We compared its rental-market view with PayProp and Rode. |
| City of Cape Town 2025/26 tariff notice | This is the municipality’s official notice for rates and selected service charges. | We used it for property rates and refuse charges. We translated the tariff figures into simple monthly landlord-cost examples. |
| SARS rental income page | SARS is South Africa’s official tax authority. | We used SARS to explain how rental income is taxed. We kept the explanation focused on individual landlords and common deductible costs. |
| City of Cape Town Comprehensive Integrated Transport Plan 2023-2028 | This is the City’s official transport planning document. | We used it to identify transit-supported rental nodes. We linked transport access to faster letting and deeper tenant demand. |
| MyCiTi Phase 2A | MyCiTi is Cape Town’s official bus rapid transit network. | We used it to understand transport corridors and demand near bus routes. We considered the CBD, Table View, Blouberg, Century City and future south-east links. |
| Property24 Cape Town rentals | Property24 is one of South Africa’s largest mainstream property portals. | We used it to check live asking-rent texture by suburb and property type. We discounted unusual luxury listings before estimating normal rents. |
| Property24 Cape Town apartments | This page gives broad apartment listing evidence across Cape Town. | We used it to compare studio, 1-bedroom and 2-bedroom asking rents. We then cross-checked the ranges with achieved-rent benchmarks. |
| Private Property Cape Town rentals | Private Property is another major South African rental marketplace. | We used it to validate listing depth and neighborhood demand. We treated it as market texture, not as the primary price source. |
| Private Property Cape Town apartments | This source gives a second portal view for Cape Town apartment supply. | We used it to compare apartment supply by bedroom count. We also used it to sense which suburbs have deeper mainstream rental stock. |
Get fresh and reliable information about the market in Cape Town
Don't base significant investment decisions on outdated data. Get updated and accurate information.
Related blog posts